Most attribution reports rely on simplified models that pull from incomplete data. They assign credit to certain touchpoints while ignoring others entirely. The result is a measurement system that feels scientific but frequently tells a misleading story.
This becomes a serious problem when those reports guide budget decisions. Channels that look strong get more spend, while those that look weak get cut. In the long run, the entire marketing strategy is planned based on a model that was never built to capture reality.
An attribution model audit is how you pressure-test what your reporting is telling you, and find where the gaps are costing you money.
This guide tells you exactly how to do that.
TL;DR
- Most attribution models rely on incomplete data and simplified rules, which means the performance numbers in your dashboard can tell a misleading story.
- Even though 91% of marketers say attribution is critical to their success, only 31% are very confident in their current attribution models.
- Different models credit different touchpoints, while privacy restrictions, cross-device behavior, and platform reporting bias further distort the data.
- An attribution model audit helps you identify these gaps by comparing models, analyzing assisted conversions, and testing incrementality.
- Strong measurement systems combine attribution with experiments, marketing mix modeling, and customer insights to understand what actually drives growth.
The Problem With Attribution Models By Design
Attribution models attempt to answer a simple question: which marketing touchpoints deserve credit for a conversion?
Every attribution model makes assumptions about how influence works within the customer journey. Some prioritize early interactions, while others reward closing channels or distribute credit evenly across all touchpoints.
Understanding the limitations of these models is the first step in identifying where reporting can mislead your marketing decisions.
Tl;dr: Attribution Model Comparison
| Model | Credit Logic | Where They Fail | Best Used For |
|---|---|---|---|
| Last-Click | 100% to final touch | Over-credits bottom funnel | Short, simple purchase paths |
| First-Click | 100% to first touch | Over-credits awareness channels | Prospecting analysis only |
| Linear | Equal across all touches | Treats all touchpoints equally | Getting a baseline view |
| Time-Decay | More credit near conversion | Favors retargeting and closers | Longer consideration cycles |
| Position-Based | 40/40 first and last | Undervalues the middle funnel | Funnels with clear entry and exit points |
| Data-Driven | Algorithmically weighted | Black box, platform-limited | High-volume accounts with clean data |
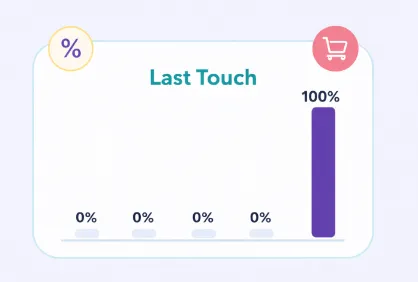
Last-Click Attribution
Last-click attribution assigns 100% of conversion credit to the final touchpoint before a purchase. For many years, this was the default model in tools like Google Analytics because it is easy to understand and implement.
However, it favors channels that appear near the end of the customer journey, such as:
- Brand search clicks
- Retargeting ads
- Email reminders
- Affiliate links
These touchpoints reach users who have already decided or are close to converting.
Channels (and, therefore, tactics) focused on generating initial awareness are typically undervalued under last-click models, including:
- Paid social prospecting
- Influencer marketing
- Content marketing
- YouTube or display advertising
These touchpoints introduce customers to the brand but rarely close the sale directly. As a result, they are deemed less effective in last-click reporting even when they play a crucial role in generating demand.
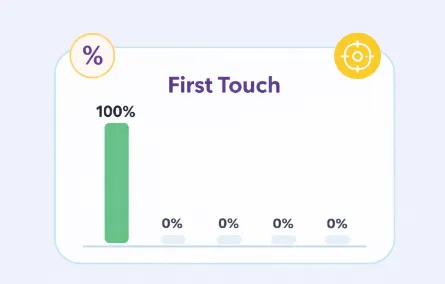
First-Click Attribution
First-click flips the logic. It gives all the credit to the first touchpoint in the customer journey, which makes it useful for understanding what initially drives awareness and brings new customers into your funnel.
The problem is that it neglects the next channels that appear in the customers’ journey.
A customer who discovers your brand through a Meta ad, then converts three weeks and four touchpoints later, after a retargeting campaign and a discount email, delivers zero credit to any of those middle and bottom-funnel efforts. First-click is as one-dimensional as last-click, just in the opposite direction.
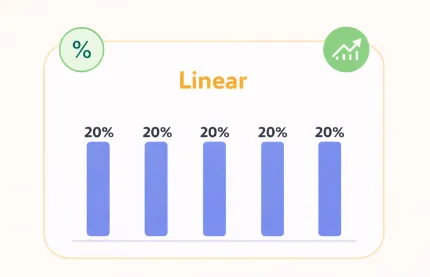
Linear Attribution
Linear attribution is one of the simplest forms of multi-touch attribution, since it distributes credit across every interaction in the path to conversion.
Instead of focusing exclusively on the first or last interaction, it recognizes that multiple touchpoints contribute to the outcome.
However, equal credit distribution rarely reflects how influence actually works.
A customer who sees your brand for the first time through a paid social ad may experience a very different level of influence than the email reminder that prompted the final purchase. Treating every interaction as equally impactful distorts performance analysis.
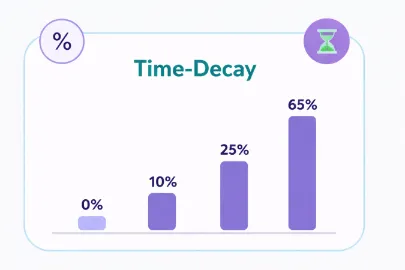
Time-Decay Attribution
Time decay gives more credit to touchpoints that happen closer to the conversion, with credit diminishing the further back in the journey you go. The logic is that interactions closer to the purchase decision carry more influence.
Still, this model introduces a bias toward retargeting and bottom-funnel channels, which are structurally positioned to appear near conversions.
Upper-funnel campaigns that build awareness weeks or months earlier get penalized simply because of when they ran, regardless of how much influence they had.
Position-Based (U-Shaped) Attribution
Position-based attribution splits most of the credit between the first and last touchpoints, typically 40% each, with the remaining 20% distributed across everything in between.
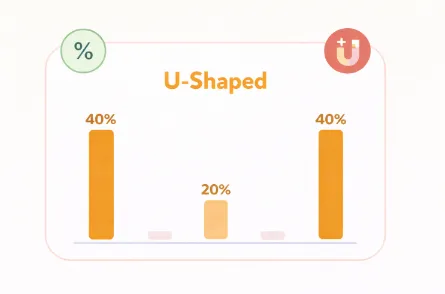
The limitation is that it still undervalues the middle of the journey. For brands with long nurture sequences, multiple retargeting layers, or content-heavy consideration phases, the touchpoints that do most of the persuasion work end up with a fraction of the credit.
Data-Driven Attribution
Data-driven attribution tends to be presented as the solution to everything above, but it still has limitations.
- It requires large volumes of conversion data to function properly, which makes it unreliable for campaigns with limited traffic.
- It also operates as a black box. The model doesn't explain how it weights touchpoints, which makes it difficult to audit or challenge.
- And it only works within the data that a platform can see. Google's data-driven model only accounts for touchpoints Google can track, so cross-channel influence from Meta, email, or organic social stays invisible.
Why Your Data Is Already Broken Before the Model Runs
Most attribution conversations focus on which model to use. That's the wrong starting point.
Before your attribution model assigns a single conversion, the data feeding it has already been filtered and fragmented by the infrastructure underneath. The model can only work with what it receives, and what it receives is rarely the full picture.
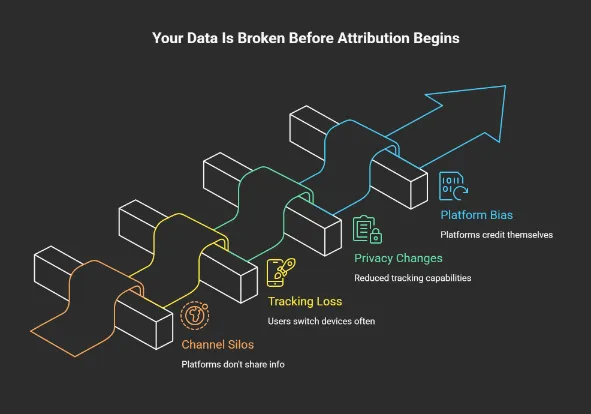
Channel Silos Create Incomplete Data
Your marketing runs across multiple platforms, but those platforms were not built to share information. Meta tracks behavior on Meta, while Google tracks behavior on Google. When you pull reporting from each separately, you're not getting a unified view of your customer journey.
Also, as mentioned earlier, offline interactions, sales conversations, and dark social activity drive significant buying behavior that your UTM parameters will never capture. If your attribution system only measures what happens online, you're building strategy on a partial dataset by default.
Tracking Loss Across Devices
Your customers don't stay on one device. In fact, around 73% of consumers use multiple devices during the purchase process.
Cookie-based tracking becomes less useful the moment a user switches browsers or moves between devices. Basically, a customer who interacts with your brand six times can technically appear as six different anonymous users in your reporting.
Cross-device journeys remain largely invisible to your attribution model, which means multi-touch credit gets misassigned or lost entirely.
Privacy Changes That Break Attribution
Privacy regulations and browser updates have significantly reduced tracking capabilities.
Browsers like Safari and Firefox already block many third-party cookies by default. Consent management requirements and privacy regulations, such as the General Data Protection Regulation, also restrict how user data can be collected and processed.
These changes introduce additional gaps in attribution data. Your attribution model is increasingly working with a sample of your customer base, and doesn’t see the full picture.
Platform Self-Attribution Bias
Advertising platforms measure performance using their own internal attribution systems. For example, an ad platform may credit itself for a conversion if a user saw or clicked an ad within a specific attribution window, even if the final conversion occurred through another channel.
Because platforms cannot observe the full cross-channel journey, this leads to inflated conversion counts.
In many cases, the total conversions reported across multiple advertising platforms exceed the total number of sales recorded in analytics tools or CRM systems.
Red Flags That Your Attribution Model Is Lying
From what we have seen working with different teams, if you notice the following signals in your reporting, your attribution model may be distorting performance.
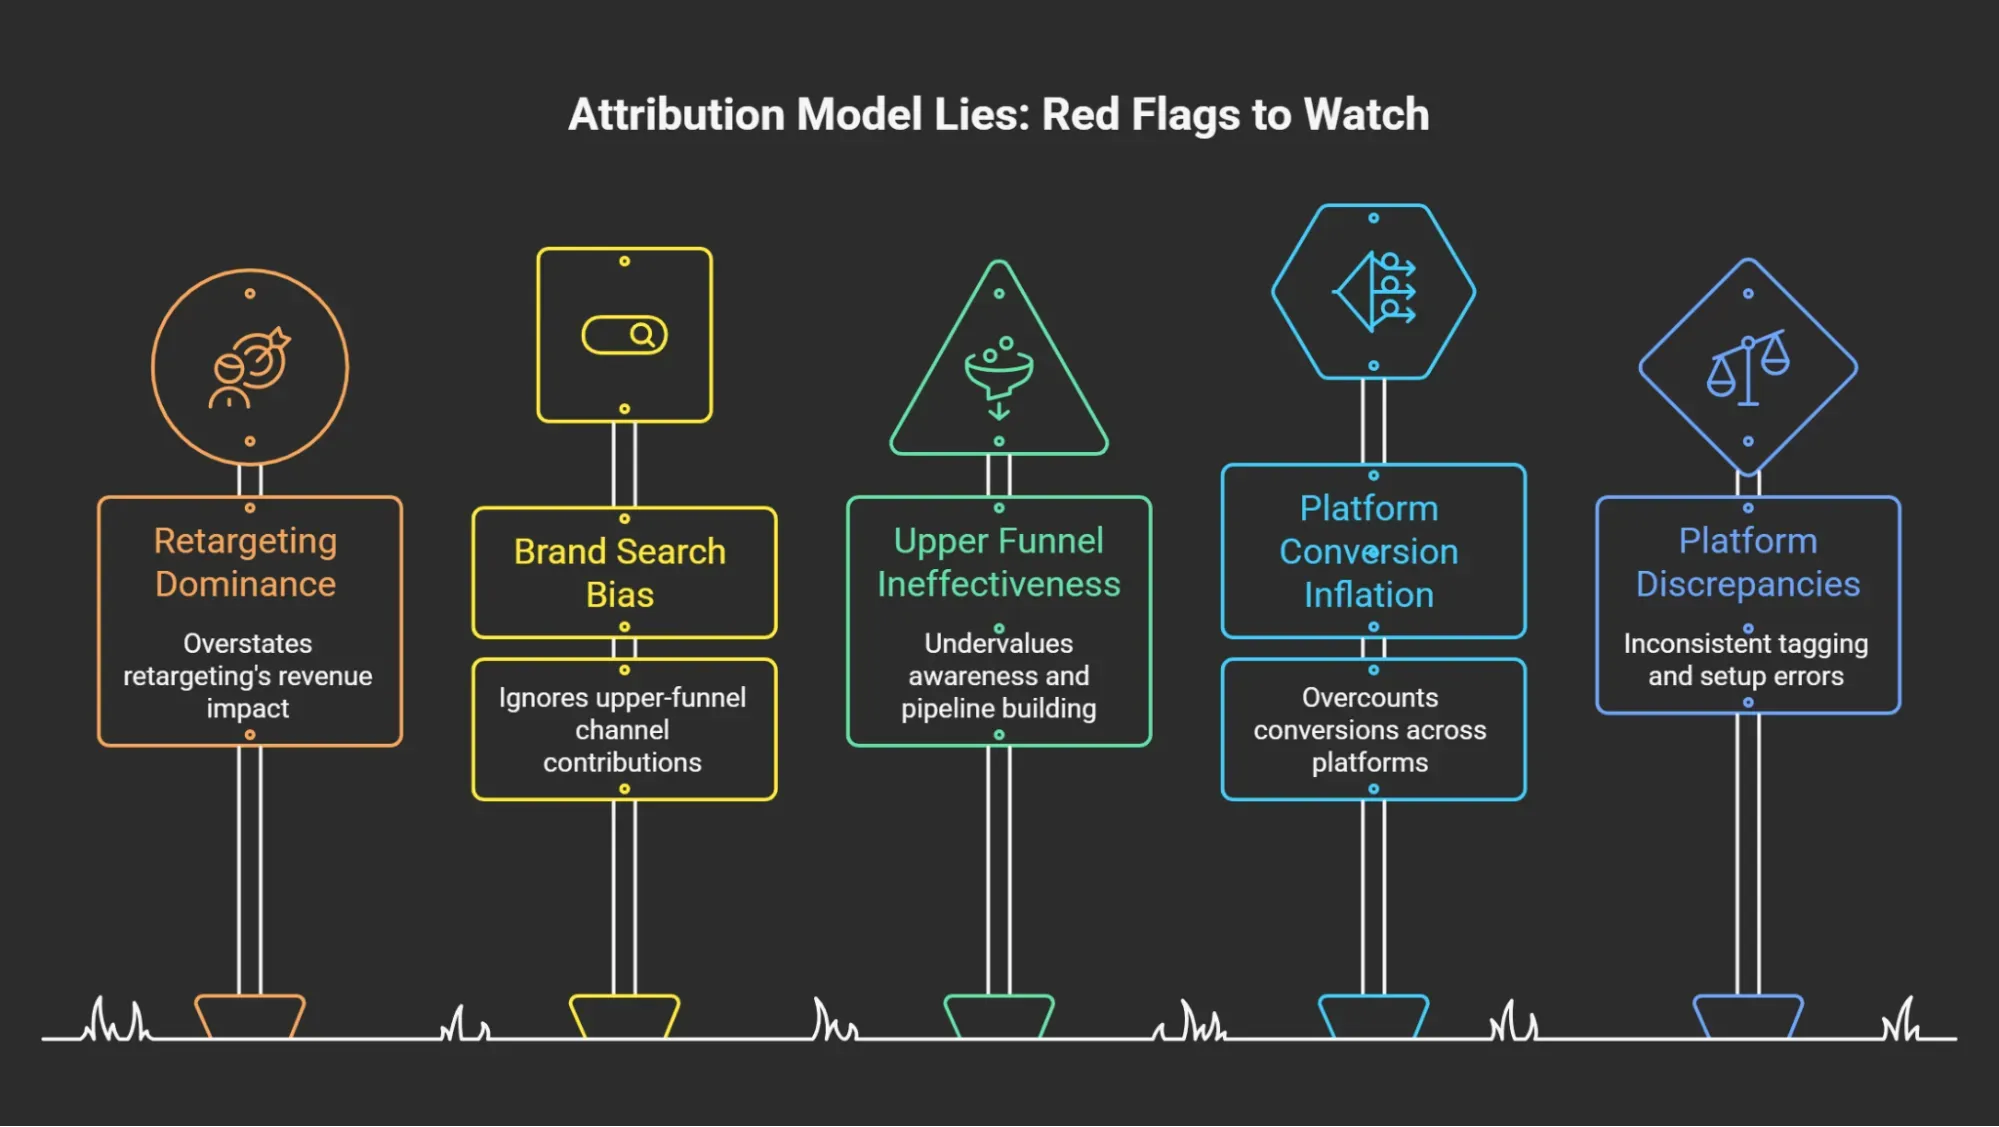
Retargeting Appears to Drive Most Revenue
If retargeting consistently shows your highest ROAS, question it before celebrating. These campaigns reach people familiar with your brand and may already have a high level of purchase intent.
Our advice may seem counterintuitive, but pause retargeting for two weeks.
If total revenue barely moves, your model was crediting demand capture, and not demand creation.
Brand Search Looks Like Your Best Channel
Branded campaigns tend to show low CPC, high conversion rates, and strong ROAS. But people typing your brand name into Google were already going to buy.
When branded search dominates your dashboard, it usually means your upper-funnel channels are doing the work and getting none of the credit.
Upper Funnel Channels Look Ineffective
If paid social, display, or content marketing consistently looks weak while bottom-funnel channels thrive, your model is undervaluing awareness. Teams that cut these channels based on attribution data quietly starve their pipeline for months before the damage shows up in revenue.
Paid Channels Claim More Conversions Than Your Total Sales
A classic attribution red flag is when your advertising platforms claim more conversions than your business recorded. This occurs because platforms apply their own attribution windows and credit rules.
For example, some advertising platforms credit conversions if:
- A user clicked an ad within 28 days, or
- Simply viewed an ad within 1 day before converting.
When multiple platforms apply similar rules, the same conversion can be counted multiple times. The result is conversion inflation across reporting systems.
Large Discrepancies Between Platforms
Some discrepancy is normal given differences in attribution windows, tracking methods, and how each platform defines a conversion. But when the numbers are significantly off, it usually points to one of three things:
- UTM tagging is inconsistent
- Pixel or conversion API setup has errors
- One platform is claiming credit it hasn't earned
Tools such as Google Analytics typically apply stricter attribution rules and rely on different tracking methods. Advertising platforms include view-through conversions and longer attribution windows.
What Bad Attribution Is Costing Your Business
When reporting assigns credit incorrectly, your organization begins optimizing around misleading signals. In time, these decisions reshape your entire marketing strategy.
Misallocated Marketing Budgets
One of the most common consequences of flawed attribution is overspending on bottom funnel channels. In turn, teams reduce investment in awareness initiatives.
Research from Cassandra across 792 marketing mix models found that in a typical portfolio, 20 to 35% of budget flows to channels with near-zero measured incrementality. The campaigns that look best in your dashboard may not always be the ones doing the most work.
Channel Cannibalization
Retargeting and branded search are efficient at capturing demand that already exists. The problem is when attribution gives them full credit for conversions that upper-funnel campaigns created.
Teams scale the channels that look best on paper and quietly defund the ones driving intent in the first place. Gradually, the pipeline thins out, and customer acquisition cost (CAC) climbs, but your attribution model won't tell you why.
Strategic Blind Spots
The most damaging impact of flawed attribution is the creation of strategic blind spots.
You may believe certain channels are ineffective when they are actually generating demand. At the same time, channels that appear highly profitable may simply be capturing conversions created elsewhere.
Without accurate measurement, it becomes extremely difficult to understand how your marketing systems truly work.
This is why attribution audits are becoming increasingly important for organizations that operate across multiple platforms and customer touchpoints.
How to Conduct an Attribution Model Audit
The goal of an attribution model audit is not to find a perfect attribution model. That does not exist. Instead, the audit helps you look at existing data more honestly and see where biases may influence your reporting.
1. Inventory All Attribution Sources
The first step we recommend is to pull together every place attribution data lives in your business: your analytics platform, each ad platform's native reporting, your CRM, and any marketing automation systems like HubSpot or Marketo.
Most teams discover four or five competing sources of conversion data, each telling a different story. Comparing these sources reveals where attribution discrepancies originate.
2. Map the Full Customer Journey
Once you identify your reporting systems, the next step is mapping the complete customer journey. Start by identifying all possible marketing touchpoints that influence conversions. These might include:
- paid advertising
- organic search
- email campaigns
- influencer partnerships
- referral traffic
- offline events
- sales conversations
It’s important to include both online and offline interactions. Many organizations underestimate the role of non-digital touchpoints such as customer referrals or sales conversations.
Pro tip: Talk to your sales and customer success teams and ask what customers say when they describe how they found you. These interactions influence purchasing decisions, even though they rarely appear in attribution reports.
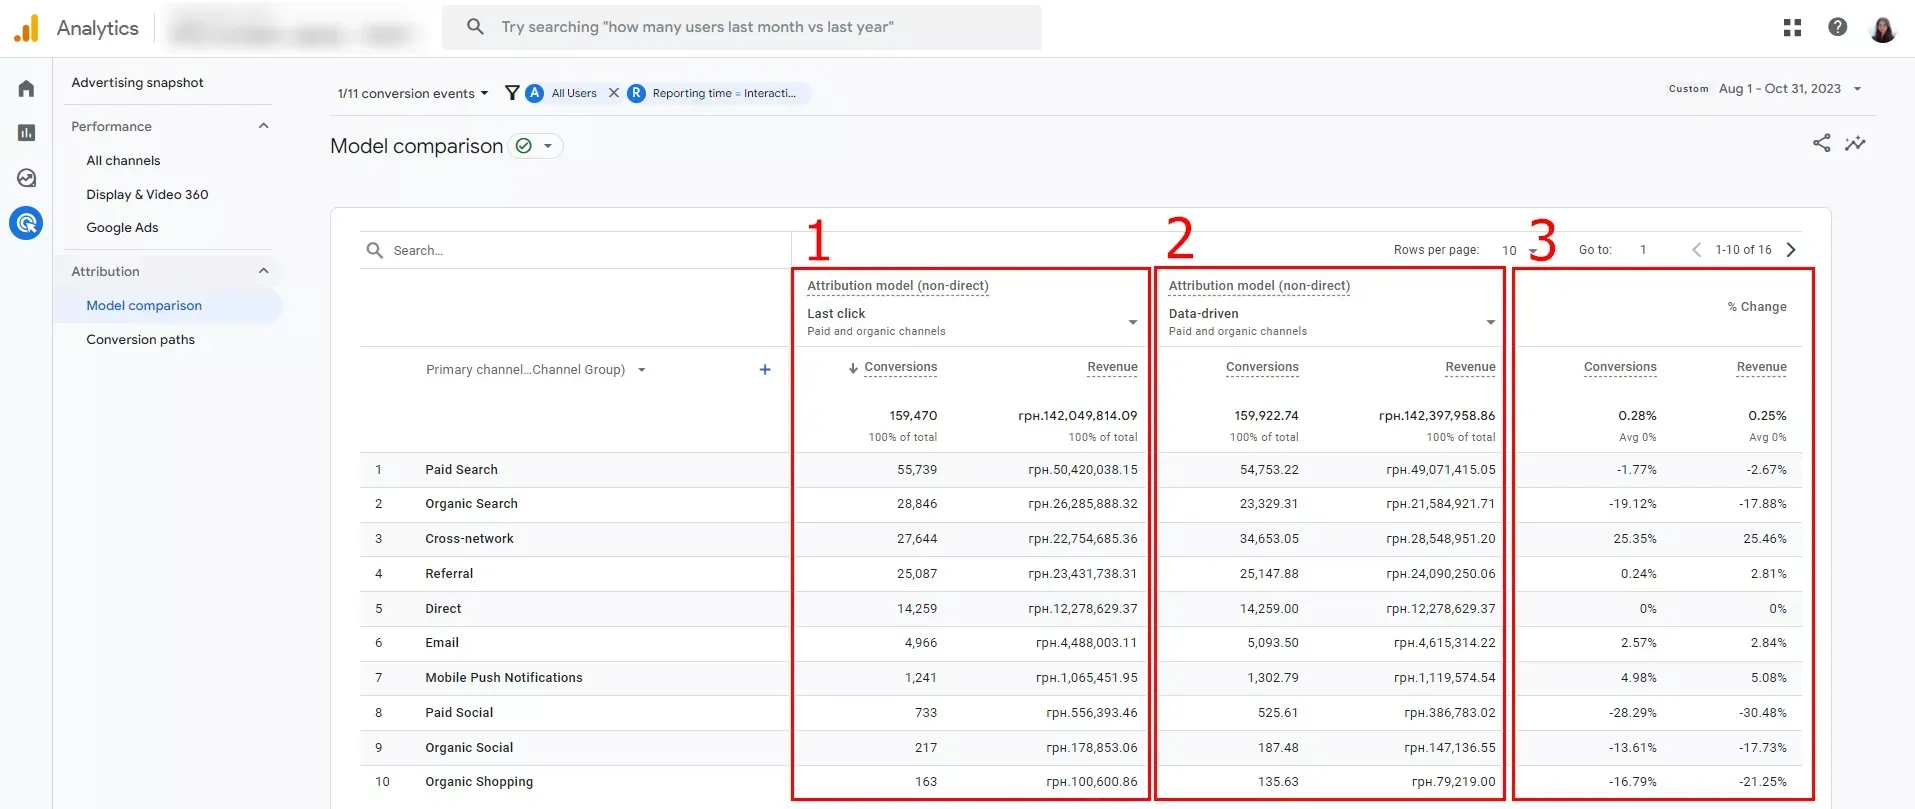
3. Compare Multiple Attribution Models
Run your conversion data through at least three different models side by side: last-click, linear, and data-driven if your platform supports it. GA4's model comparison report makes this straightforward without requiring additional tools.
Then look at where the credit shifts.
If one channel gains or loses more than 20% of its attributed conversions, depending on the model, your current setup is making a significant assumption about that channel's role. Those shifts are where the audit gets interesting.
4. Analyze Assisted Conversions
Assisted conversions help reveal channels that influence the customer journey, even when they are not the final interaction.
For instance, a user might first discover your brand through a video ad, later sign up for an email list, and eventually convert through a branded search.
In a last click model, the branded search receives full credit. However, assisted conversion reporting shows the earlier interactions that contributed to the outcome.
Analyzing assisted conversions provides a more balanced view of how different channels support the buying process. Rockerbox, for example, is particularly strong at surfacing cross-channel influence, including harder-to-track channels like podcasts and direct mail.
5. Identify Platform Self-Reporting Bias
Pull the total conversions reported by each of your ad platforms and sum them. Then compare that number against your actual order count or revenue for the same period.
When the combined platform total significantly exceeds your actual sales, every budget decision based on that data inherits the same inflation.
Note which platforms show the largest discrepancy. Those are the ones to scrutinize most closely.
6. Conduct Incrementality Tests
Incrementality testing is where the audit moves from diagnosis to proof. Rather than analyzing what your attribution model says, you run controlled experiments to measure what happens when marketing activity changes.
The most practical tests to start with are:
- Budget pause tests, where you pause a specific channel for two to four weeks and measure the impact on total revenue.
- Holdout groups, where you exclude a segment of users from seeing ads and compare their behavior with exposed audiences.
- Geo lift tests, where you pause campaigns in specific markets and compare performance against regions where they continue running.
For teams ready to go deeper, platform-native lift studies on Meta and Google can run alongside your campaigns without manual intervention.
What Better Attribution Looks Like
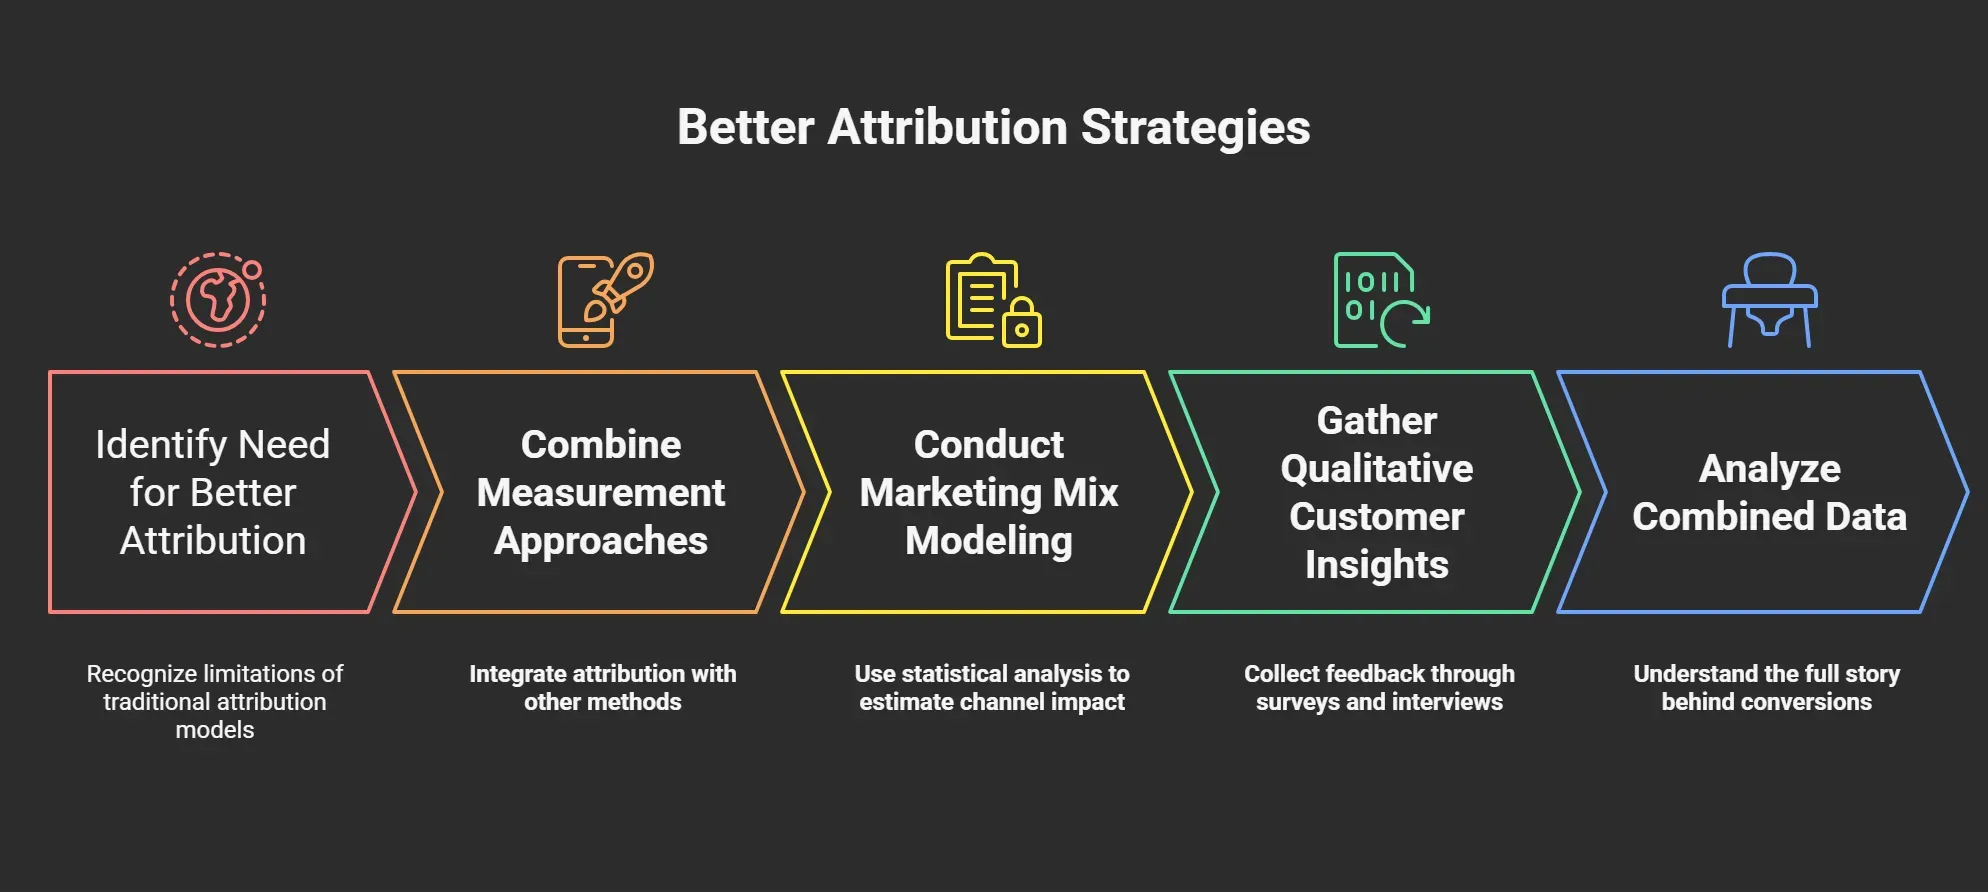
Attribution models are useful, but they cannot capture every influence in the customer journey. A better approach combines attribution with other methods that reveal long-term and less visible effects.
Here are approaches that help complete the picture.
Marketing Mix Modeling for Strategic Decisions
Marketing mix modeling (MMM) uses statistical analysis to estimate the impact of each marketing channel, including channels that do not generate clicks or trackable touchpoints.
In our experience, MMM is especially useful for strategic budget allocation. Instead of asking which ad closed the sale, it asks how changes in spend across channels affect overall revenue over time.
This method can account for factors that attribution dashboards usually ignore, including offline media, seasonality, and broader market conditions.
When organizations reallocate budgets based on MMM insights, studies show they can identify 10–20% improvements in marketing efficiency through better spend distribution.
For example, Aaron Whittaker of Thrive Internet Marketing Agency describes how MMM uncovered hidden channel interactions during a retail campaign.
“When analyzing a retail client's holiday campaign performance, instead of looking at channels in isolation, our MMM revealed unexpected synergies between radio advertising and social media. We discovered that radio ads during morning commute times amplified social media engagement by 25% in the following hours – an insight that wouldn't have been visible through traditional attribution models.” (Aaron Whittaker, Thrive Internet Marketing Agency)
The tradeoff is that MMM requires significant historical data and longer time horizons to produce reliable results. When used alongside attribution analysis and experimentation, it provides a more complete view of where your marketing budget is actually working.
Qualitative Customer Journey Insights
Numbers tell you what happened, but they rarely explain why.
Some of the most influential touchpoints in a customer journey never appear in attribution reports. Word of mouth, podcast mentions, private community discussions, and internal referrals drive awareness without leaving a measurable trail.
Post-purchase surveys are one of the simplest ways to uncover these hidden influences. A single question, such as “How did you first hear about us?” can show you channels that never appear in attribution dashboards.
Customer interviews go even deeper. In our experience, when you ask recent buyers to describe how they discovered and evaluated your product, the journey looks very different from what your attribution model suggests.
Combining these qualitative insights with quantitative reporting helps you understand the full story behind your conversions.
Audit Your Attribution Framework With 9AM
Attribution models are approximations. They account for the touchpoints they can see, apply rules that favor certain channels, and produce numbers that feel precise even when they are not.
By the time those numbers inform a budget decision, the gap between what the model shows and what drives revenue becomes significant.
At 9AM, we approach measurement differently. We reconcile platform data with neutral analytics sources, run incrementality tests to identify real channel impact, and connect attribution to revenue outcomes.
If your reporting looks clean but your CAC keeps rising, your attribution model deserves a closer look.
Book a strategy call today, and we will review your measurement setup, identify the gaps, and show you where attribution is misleading your decisions.
FAQs
What is the difference between attribution modeling and marketing mix modeling?
Attribution modeling analyzes individual user journeys and assigns conversion credit to different marketing touchpoints. Marketing mix modeling analyzes aggregated data across longer time periods to estimate how different channels influence overall revenue trends. Attribution models tend to be used for tactical optimization, while marketing mix modeling helps guide strategic budget allocation.
How often should an attribution audit be performed?
Most organizations benefit from reviewing their attribution framework at least once per year. However, major changes in tracking infrastructure, privacy regulations, or marketing channel mix may require more frequent reviews. As tracking environments change, your attribution assumptions may become outdated.
Do AI attribution tools solve attribution bias?
AI-based attribution models can analyze large datasets and identify patterns in customer journeys. However, they still rely on the same underlying tracking data as traditional attribution models.
If important touchpoints are missing from the data, even advanced algorithms cannot account for them. AI attribution tools may improve modeling accuracy, but they cannot eliminate structural measurement gaps.
What is the best attribution model?
There is no universally “best” attribution model. Each model reflects different assumptions about how marketing influence works within the customer journey. The most effective approach is to compare multiple models and combine attribution insights with other measurement techniques, such as experimentation and marketing mix modeling.
How do privacy changes affect attribution accuracy?
Privacy regulations and browser restrictions have reduced the amount of trackable user data available to marketers. Features like cookie blocking, tracking prevention, and consent requirements limit visibility across devices and platforms. As a result, attribution models increasingly operate on incomplete datasets. This can cause certain channels to appear stronger or weaker than they actually are.
Research Sources: Appendix
- https://marketingltb.com/blog/statistics/marketing-attribution-statistics/
- https://www.allmultidisciplinaryjournal.com/uploads/archives/20221210190300_F-22-79.1.pdf
- https://cassandra.app/resources/marketing-attribution-software-analysis
- https://www.leadgen-economy.com/blog/marketing-mix-modeling-lead-generation-guide/
- https://blog.hubspot.com/marketing/media-mix-modeling