
Traffic, ad spend, hook rates, video views, CTR, and conversion rates can show how your campaigns are performing. But they do not always show whether people remember your brand, prefer it, or recommend it.
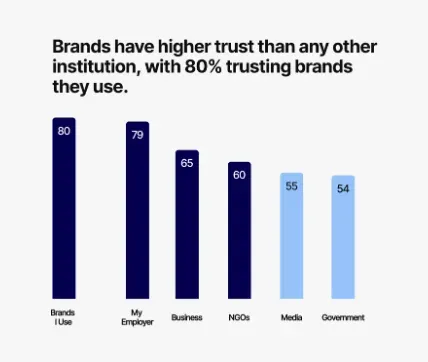
Trust is one of the clearest signs of brand health.
Edelman’s 2025 Brand Trust report found that 80% of people trust the brands they use, which shows how closely trust is tied to brand strength and customer behavior.
For performance marketing teams, this indicator is easy to miss.
You may see strong creative performance in Meta Ads Manager, TikTok Ads Manager, or YouTube Ads, but still have weak brand recall, poor sentiment, or low purchase intent.
This is where brand health metrics help.
Brand health metrics help you measure the deeper signals behind long-term growth. They show how your audience sees your brand across awareness, perception, consideration, loyalty, advocacy, and competitive visibility.
In this guide, we’ll cover:
- What brand health means and why it matters
- The key brand health metrics, formulas, and survey questions to use
- How to set benchmarks using historical, competitive, industry, and campaign data
- How to build a simple dashboard and turn the data into better marketing decisions
P.S.: If you want to connect brand health with paid media, creative performance, attribution, and customer data, 9AM’s marketing measurement frameworks can help you build a clearer view of what is working across channels.
Brand Health Benchmarks: Strong Signals and Warning Signs
You can use the table below as a practical starting point for reading each metric. It shows what to compare, what a healthy signal looks like, and what should raise concern.
Brand Metrics & Signal Interpretation Framework
| Metric | Benchmark Method | Strong Signal | Warning Signal |
|---|---|---|---|
| Brand awareness | Compare against competitors and past surveys | Awareness is rising in the target segment | Awareness is flat despite spend |
| Unaided recall | Run a category survey | Your brand appears without a prompt | Competitors are named first |
| Brand sentiment | Compare positive and negative mentions | Positive sentiment is rising | Negative sentiment spikes |
| Share of voice | Compare visibility against total category visibility | Share of voice is growing faster than competitors | Share of voice rises with negative sentiment |
| Share of search | Compare branded searches against competitor searches | Branded demand is increasing | Competitor search growth outpaces yours |
| Consideration | Survey category buyers | More buyers consider your brand | Awareness is high but consideration is low |
| Purchase intent | Use surveys or high-intent actions | Intent increases after campaigns | Interest does not convert into intent |
| NPS | Subtract detractors from promoters | Positive score with clear reasons behind it | Detractors outnumber promoters |
| CSAT | Divide satisfied respondents by total respondents | Score is around 70% to 85% or higher | Satisfaction declines after key touchpoints |
| Retention | Track repeat purchase or renewal rate | Retention is improving | Churn is rising |
| Brand trust | Use surveys and review data | Trust improves across key segments | Trust gaps appear in reviews or feedback |
What Is Brand Health?
Brand health is the overall strength of a brand in the market and in the minds of customers. It shows whether people know your brand, trust it, consider it, choose it over competitors, and recommend it to others.
A healthy brand usually has strong awareness, positive perception, clear differentiation, high consideration, and loyal customers.
This is why brand health should be checked regularly, the same way you would check any important part of your business. As Dave Foster, Forbes Councils Member, puts it:
“Businesses should be as invested in their brand health as all of us should be in our personal health. Just as your annual wellness visit is an act of disease prevention, a brand health program is an investment in the future of your business.” (Dave Foster, “Assessing Brand Health: A Practical Checklist For B2B Marketers”)
What Brand Health Tells You
Brand health helps you understand where your brand is strong and where it may be losing ground.
It can show you:
- Recognition: Can people remember your brand name, logo, offer, or category connection when they see your content or ads?
- Associations: Do they connect your brand with quality, expertise, value, speed, innovation, or any other attribute you want to own?
- Competitive preference: Are people choosing your brand when they compare options, or are competitors still winning the final decision?
- Customer loyalty: Do customers stay, buy again, leave positive reviews, refer others, or recommend your brand?
- Long-term brand value: Are your campaigns creating stronger recall, trust, consideration, and loyalty over time, or are they only driving short-term clicks and conversions?
Brand Health vs Brand Awareness vs Brand Equity
Brand awareness tells you whether people know your brand exists. Brand health shows how your brand is performing right now across trust, sentiment, consideration, preference, and loyalty. And brand equity looks at the long-term value your brand creates for the business.
All these are related, but they measure different parts of brand performance.
Brand Strategy Concepts Explained
| Concept | What It Measures | Example |
|---|---|---|
| Brand awareness | Whether people know your brand exists |
Unaided recall
Aided recall
Branded search
|
| Brand health | Overall condition of the brand |
Awareness
Sentiment
Loyalty
Preference
Trust
|
| Brand equity | Long-term value created by the brand |
Pricing power
Customer loyalty
Market strength
Trust
|
Why Measuring Brand Health Matters
Brand health helps you see what is happening underneath your campaign numbers. Sales, traffic, and conversion rates show current performance, but brand health shows whether your audience is becoming more aware, more trusting, and more likely to choose you repeatedly in the long run.
1. Reveals Problems Before Revenue Drops
Revenue problems rarely appear out of nowhere. You usually see early warning signs first.
For example:
- Declining sentiment can signal future churn
- Falling awareness can reduce future pipeline
- Lower purchase intent can weaken future sales
- Negative reviews can damage trust before they affect conversion rates
This is why brand health matters for marketing teams. If sentiment drops or consideration slows down, you can fix the issue before it starts hurting acquisition, retention, or sales.
Customers can leave faster than teams expect. PwC found that 32% of customers would stop doing business with a brand they loved after one bad experience, which makes sentiment, satisfaction, reviews, and trust worth tracking early.
2. Helps Connect Brand Marketing to Business Outcomes
Brand marketing can feel hard to measure when you only look at short-term campaign data. Brand health metrics give you a clearer way to connect brand work with business decisions.
They can help you improve:
- Positioning
- Messaging
- Campaign strategy
- Customer experience
- Product development
- Competitive strategy
For example, if people know your brand but do not consider it, your messaging may need sharper proof points. If customers like your product but do not recommend it, you may need to improve trust, onboarding, or customer experience.
This makes brand health tracking useful because it connects paid media, customer feedback, search demand, and long-term brand signals in one view.
3. Helps Teams Benchmark Progress
Brand health also gives you a clear baseline. Once you know where you stand, you can track whether your brand is getting stronger or weaker over time.
You can benchmark progress against:
- Your previous performance
- Your direct competitors
- Industry standards
- Campaign goals
Unfortunately, Nielsen’s 2025 Annual Marketing Report found that only 32% of global marketers measure media spend holistically across digital and traditional channels.
So, you should evaluate all those dimensions to understand your brand health. Instead of asking whether your brand “feels stronger,” you can see what changed, where the gap is, and what needs attention next.
The Core Brand Health Metrics to Track
Before you build a brand health dashboard, you need to know which signals actually matter.
Below, we analyzed brand health metrics that will help you measure how well your brand is known, trusted, considered, chosen, and recommended.
1. Brand Awareness
Brand awareness measures how familiar your target audience is with your brand. It tells you whether people recognize your name, remember you in the right category, and connect your brand with the problem you solve.
If people are seeing your video ad, Meta campaigns, or Instagram feed content but still do not remember your brand later, you may have reach without real awareness.
Types of Brand Awareness
Brand awareness can show up in a few different ways, depending on how easily people remember or recognize your brand.
- Unaided awareness: People can name your brand without seeing a prompt or list.
- Aided awareness: People recognize your brand when they see it in a list of options.
- Top-of-mind awareness: Your brand is the first one people mention when they think about your category.
How to Measure Brand Awareness
You can measure brand awareness through:
- Brand tracking surveys.
- Search volume for branded terms.
- Direct website traffic.
- Social mentions.
- Google Trends.
- Share of search.
- Brand lift studies after major campaigns
Example Survey Questions
We suggest using questions like:
- “Which brands come to mind when you think of [category]?”
- “Have you heard of [brand]?”
- “Which of these brands are you familiar with?”
- “Which brand would you name first in this category?”
Benchmark Guidance
Do not judge awareness in isolation. Compare it against:
- Your previous awareness score
- Competitor awareness
- Category leaders
- Brand lift before and after major campaigns
- Branded search growth over time
For example, if your ad spend and video views are increasing but unaided awareness stays flat, your campaigns may be getting attention without making the brand memorable. This is a sign to review your creative strategy, messaging, and brand cues.
2. Brand Recall
Brand recall measures whether people can remember your brand when they need a product or service in your category.
This is stronger than simple recognition. Someone may recognize your brand when they see it in a list, but recall shows whether your brand comes to mind without help.
How to Measure It
You can measure brand recall through:
- Unaided recall surveys.
- Category association questions.
- Post-campaign recall studies.
- Search behavior around branded and category terms
- Follow-up surveys after Meta campaigns, YouTube Ads, or TikTok campaigns
For video-heavy campaigns, recall studies become even more useful. Google found that 94% of analyzed YouTube campaigns drove a significant lift in ad recall, with an average lift of 80%.
So if you are running YouTube Ads, Meta campaigns, or TikTok campaigns, recall studies can show whether your video content is helping people remember your brand.
Brand Recall Formula
For example, if 200 out of 1,000 survey respondents mention your brand without being reminded of it, your brand recall rate is 20%.
Example Survey Questions
You can ask questions like:
- “Which brands come to mind when you need [product or service]?”
- “Which companies do you remember seeing ads from in this category?”
- “Which brand would you name first for [category]?”
When This Metric Matters Most
Brand recall is useful when you are:
- Entering a new market
- Running a rebrand
- Educating buyers about a category
- Investing in brand campaigns
- Trying to stand out against competitors
If recall is low, your audience may be seeing your content but not remembering your brand. In such cases, you should review your messaging, brand cues, creative strategy, and campaign consistency.
3. Brand Recognition
Brand recognition measures whether people can identify your brand when they see your name, logo, slogan, packaging, colors, or visual identity.
This is different from brand recall. Recall asks, “Can people remember you without help?” Recognition asks, “Do people know it is you when they see elements that define your identity?”
How to Measure It
You can measure brand recognition through:
- Aided survey questions
- Logo recognition tests
- Ad recall studies
- Visual identity testing
- Packaging or product image tests
- Creative testing across Meta Ads, TikTok Ads, YouTube Ads, and display campaigns
Example Survey Questions
You can ask questions like:
- “Which of the following brands have you seen before?”
- “Which logo do you recognize from this category?”
- “Have you seen this brand in an ad, store, search result, or social feed?”
- “Which brand does this packaging, slogan, or visual style belong to?”
Why it Matters
Brand recognition helps you understand whether your visual identity is strong enough to stand out. If people see your video ad, Reels placements, Instagram feed ads, or website content but cannot connect it back to your brand, your creative may be getting attention without building recognition.
This is a sign to review your logo placement, brand colors, product shots, on-screen prompts, and overall creative consistency.
4. Brand Sentiment
Brand sentiment measures whether people feel positively, negatively, or neutrally about your brand.
It helps you understand the emotional side of brand health. People may know your brand, but sentiment shows whether that awareness is connected to trust, frustration, excitement, doubt, or confidence.
For example, your Meta Ads or TikTok campaigns may drive strong video views and audience engagement, but if the comments, reviews, or support tickets are mostly negative, your brand health may still be at risk.
How to Measure It
You can measure brand sentiment through:
- Social listening
- Review analysis
- Customer feedback
- Support tickets
- Survey sentiment questions
- Media monitoring
- Comment analysis on Meta Ads, TikTok Ads, YouTube Ads, and organic posts
Brand Sentiment Formula
For example, if you have 800 positive mentions, 120 negative mentions, and 1,000 total mentions, your brand sentiment score is 68%.
How to interpret brand sentiment
- Positive sentiment: People trust, like, or feel confident about your brand
- Neutral sentiment: People know your brand, but the emotional connection may be weak
- Negative sentiment: Reputation, product, pricing, service, or messaging issues may be affecting how people see your brand
Example Survey Questions
You can ask questions like:
- “How would you describe your overall feeling toward [brand]?”
- “Do you feel positive, neutral, or negative about [brand]?”
- “What is the main reason for your opinion of [brand]?”
- “How has your perception of [brand] changed recently?”
If sentiment starts dropping, we suggest looking at the themes behind it. Are people complaining about pricing, product quality, customer support, delivery, ad frequency, or unclear messaging? The score gives you the signal, but the comments tell you what to fix.
5. Share of Voice
Share of voice measures how visible your brand is compared with competitors. It shows how much of the category conversation, search visibility, media attention, or ad visibility your brand owns.
For example, if your competitors are showing up more in social conversations, PR mentions, search results, or paid placements, your share of voice may be lower even if your own campaigns are performing well.
Share of Voice Formula
The input can change depending on the channel you are measuring. For example, you might calculate share of voice using social mentions, media mentions, paid impressions, organic search visibility, or review platform visibility.
Types of Share of Voice
You can track share of voice across:
- Organic search share of voice
- Paid search impression share
- Social media share of voice
- PR and media share of voice
- Review platform visibility
- AI search or share of model mentions, if relevant
Benchmark Guidance
Compare your share of voice against:
- Direct competitors
- Market share
- Previous quarter
- Campaign periods
- Product launch windows
Insider tip: A higher share of voice is not always a win on its own. A spike can come from a strong campaign, but it can also come from negative press, customer complaints, or a product issue.
This is why we always pair share of voice with sentiment. If visibility is rising and sentiment is positive, your brand is gaining healthy attention. If visibility is rising and sentiment is negative, you need to investigate what is driving the conversation.
6. Share of Search
Share of search measures how often people search for your brand compared with competitors in the same category.
It is a useful brand health signal because search behavior shows active interest. If more people are typing your brand name into Google, it usually means your brand is becoming more memorable, trusted, or relevant to the market.
How to Measure It
You can measure share of search through:
- Google Trends
- Google Search Console
- SEO platforms
- Branded keyword volume
- Competitor branded search comparison
- Search demand before and after campaigns
Share of Search Formula
For example, if your brand gets 10,000 branded searches in a month and the total branded search volume across your competitor set is 50,000, your share of search is 20%.
Why It Matters
Share of search can help you understand whether your marketing is creating real brand demand.
It can show you:
- Whether more people are actively looking for your brand
- Whether your brand demand is growing faster than competitors
- Whether Meta campaigns, YouTube Ads, TikTok campaigns, or PR activity are increasing search interest
- Whether your user acquisition is coming from brand demand or mainly from paid media
- Whether your brand is gaining stronger category visibility over time
If your ad spend, video views, and CTR are rising but share of search is flat, your campaigns may be driving clicks without building deeper brand interest. That is a good time to review your creative strategy, audience targeting, and messaging.
7. Brand Consideration
Brand consideration measures whether people would seriously think about buying from your brand.
This is where awareness starts turning into something more meaningful. People may know your brand exists, but consideration shows whether they see you as a real option when they are comparing choices.
In fact, McKinsey’s consumer decision journey research found that brands in the initial consideration set can be up to three times more likely to be purchased than brands outside it. The research was based on purchase decisions from almost 20,000 consumers across five industries and three continents.
This shows that consideration is such an important brand health metric. If people recognize your brand but do not shortlist it, your awareness is not turning into buying interest yet.
How to Measure It
You can measure brand consideration through:
- Surveys
- CRM pipeline data
- Product page engagement
- Trial or demo requests
- Wishlist or cart behavior
- Comparison page traffic
- High-intent branded search behavior
Example Survey Questions
You can ask questions like:
- “Which of these brands would you consider buying from?”
- “Would you consider [brand] the next time you need [product or service]?”
- “Which brands would make your shortlist?”
- “What would make you more likely to consider [brand]?”
Benchmark Guidance
Track brand consideration by audience segment, such as:
- Existing customers
- Prospects
- Category buyers
- Competitor customers
- High-intent website visitors
- Target accounts or buying committees
If awareness is high but consideration is low, people may recognize your brand without seeing enough reason to choose it. This usually points to gaps in positioning, proof points, pricing, reviews, or competitive differentiation.
8. Purchase Intent
Purchase intent measures how likely people are to buy from your brand within a specific time frame.
It goes one step beyond consideration. Consideration tells you whether someone would shortlist your brand. Purchase intent tells you whether they are close to taking action.
For example, someone may consider your brand after seeing a video ad, reading reviews, or comparing options. But purchase intent shows whether that interest is strong enough to turn into a signup, request of any kind, free download and more, as you can see below.
How to Measure It
You can measure purchase intent through:
- Survey questions
- Trial signups
- Demo requests
- Cart additions
- Quote requests
- Product comparison behavior
- High-intent website actions
- Branded search behavior after campaigns
Example Survey Question
You can ask:
“How likely are you to purchase from [brand] in the next 3 months?”
Suggested Scale
Use a simple scale like:
- Very unlikely
- Unlikely
- Neutral
- Likely
- Very likely
Why it Matters
Purchase intent helps you see whether your marketing is creating real buying interest.
If your Meta Ads, TikTok Ads Manager data, or YouTube Ads show strong video views, hook rates, and audience engagement, but purchase intent stays low, your creative may be getting attention without moving people closer to buying.
This is a sign to review your offer, proof points, pricing, landing page, creative testing framework, and audience targeting.
9. Brand Preference
Brand preference measures whether people choose your brand over the alternatives they know and consider.
This is where brand health gets measured on a more competitive dimension. Someone may be aware of your brand and even consider it, but preference shows whether they would pick you when other options are available.
How to Measure It
You can measure brand preference through:
- Competitive preference surveys
- Win/loss analysis
- Customer interviews
- Review comparisons
- Market research panels
- Sales call feedback
- Competitor comparison page behavior
Example Survey Questions
You can ask questions like:
- “If all options were available at a similar price, which brand would you choose?”
- “Which brand would be your first choice in this category?”
- “Why would you choose that brand over the others?”
- “What would make you choose [brand] instead?”
Why It Matters
Preference is stronger than awareness because it shows whether people see a clear reason to choose you.
It can help you understand:
- Whether your brand has meaningful differentiation
- Whether customers see enough value to choose you over competitors
- Whether your pricing feels justified
- Whether your brand has loyalty potential
If consideration is high but preference is low, buyers may be comparing you but choosing someone else. In our experience, this usually points to gaps in positioning, proof points, customer reviews, social proof, or competitive messaging.
10. Net Promoter Score
Net promoter score, or NPS, measures customer loyalty and how likely people are to recommend your brand.
It is useful because a recommendation is a strong signal of brand health. If customers are willing to refer you to a friend, colleague, or another buyer, they likely trust your brand enough to put their own name behind it.
How to Measure It
Ask customers one simple question:
“How likely are you to recommend [brand] to a friend or colleague?”
Bain’s Net Promoter System scores this on a 0 to 10 scale and groups responses into promoters, passives, and detractors.
- Promoters score 9 to 10
- Passives score 7 to 8, and
- Detractors score 0 to 6
![An infographic explaining the Net Promoter Score (NPS) framework using a 0–10 rating scale. The question at the top asks: “How likely are you to recommend [Company] to a friend or colleague?” Ratings from 0 to 6 are grouped as “Detractors” and shown with a red unhappy face icon, indicating dissatisfied customers. Ratings 7 and 8 are labeled “Passives” with a neutral gray face icon, representing indifferent customers. Ratings 9 and 10 are categorized as “Promoters” with a yellow smiling face icon, indicating highly satisfied and loyal customers likely to recommend the brand. The scale visually progresses from “Not at all likely” on the left to “Extremely likely” on the right.](https://ghost.nine.am/content/images/2026/05/Net-Promoter-Score--NPS--Recommendation-Scale.webp)
NPS Formula
For example, if 60% of respondents are promoters and 20% are detractors, your NPS is 40.
Benchmark Guidance
Use NPS benchmarks carefully because scores vary by industry, survey timing, sample size, and customer expectations.
As a general guide:
- Above 0 means you have more promoters than detractors
- Above 20 is generally favorable
- Above 50 is commonly treated as excellent
- Above 80 is very strong, but rare and highly dependent on category
Insider tip: Do not rely only on NPS. Pair it with open-ended feedback: “What is the main reason for your score?” The score will show you how loyal customers feel. Whereas the follow-up answer will show why they feel that way and what you need to improve.
11. Customer Satisfaction Score
Customer satisfaction score, or CSAT, measures how satisfied customers are with a specific interaction, product, service, or overall experience.
It is different from NPS. NPS measures whether someone would recommend your brand. CSAT measures how happy they were with a particular moment, such as a support call, onboarding flow, purchase experience, or renewal process.
How to Measure It
Ask customers a simple satisfaction question after a key interaction, such as:
“How satisfied were you with your experience?”
You can use a scale like:
- Very dissatisfied
- Dissatisfied
- Neutral
- Satisfied
- Very satisfied
Salesforce explains CSAT as the percentage of respondents who rate themselves as satisfied or very satisfied. For example, if 80 out of 100 respondents choose satisfied or very satisfied, your CSAT score is 80%.
CSAT Formula
For example, if 340 out of 400 respondents say they were satisfied, your CSAT score is 85%.
Benchmark Guidance
A CSAT score around 70% to 85% is generally considered good, but the right benchmark depends on your industry, sample size, survey method, and customer expectations.
We suggest tracking CSAT by touchpoint instead of looking only at one overall score. A brand may have strong product satisfaction but weak support satisfaction, or strong onboarding satisfaction but poor renewal satisfaction.
Best Use Cases
CSAT is most useful for measuring:
- Customer support experience
- Product onboarding
- Purchase experience
- Renewal process
- Post-service feedback
If CSAT drops after a specific touchpoint, look at the comments, support tickets, and customer feedback around that moment. The score tells you where satisfaction is slipping. The feedback tells you why.
12. Customer Loyalty and Retention
Customer loyalty and retention measure whether customers keep buying from your brand after the first purchase.
This is one of the clearest signs of brand health. If people come back, renew, upgrade, refer others, or stay engaged over time, your brand promise is likely matching the customer experience.
Metrics to Include
You can track loyalty and retention through:
- Repeat purchase rate
- Retention rate
- Churn rate
- Customer lifetime value
- Renewal rate
- Subscription expansion
- Loyalty program engagement
- Referral activity
- Review and testimonial volume
Why It Belongs in Brand Health
Strong brands make customers want to stay. Retention can show whether your product, service, pricing, support, and messaging are aligned with what customers expected when they first bought from you.
For example, if your user acquisition is strong but churn is rising, your campaigns may be bringing in customers who are not staying. This is a signal to review your onboarding, customer support, product experience, and post-purchase communication.
What to Watch for
Look for patterns like:
- High repeat purchase rate with low referral activity
- Strong retention but weak customer lifetime value
- High churn after onboarding
- Low renewal rate after price changes
- Loyalty program engagement dropping over time
When loyalty is weak, we usually look at the gap between what the brand promised and what the customer experienced. This gap is where retention problems usually start.
13. Brand Trust
Brand trust measures whether people believe your brand is credible, reliable, and safe to buy from.
This matters because trust affects almost every part of brand health. If people trust your brand, they are more likely to consider you, choose you, stay with you, and recommend you. If trust is weak, even strong awareness or high traffic may not turn into sales.
In fact, a PwC survey found that 40% of consumers stopped buying from a company because they did not trust it. This makes trust a brand health metric worth tracking before weak trust starts showing up as lower conversion rates and retention, or fewer repeat purchases.
How to Measure It
You can measure brand trust through:
- Trust surveys
- Review ratings
- Complaint volume
- Customer interviews
- Third-party reputation platforms
- Media sentiment
- Social comments and customer feedback
- Support ticket themes
Example Survey Questions
You can ask questions like:
- “I trust [brand] to deliver on its promises.”
- “I believe [brand] is transparent and reliable.”
- “I feel confident buying from [brand].”
- “I believe [brand] handles customer issues fairly.”
- “I would feel comfortable recommending [brand] to someone else.”
What to Watch For
Trust can weaken for many reasons, such as unclear pricing, poor customer support, product quality issues, negative reviews, or inconsistent messaging.
If trust scores are low, look at the language people use in reviews, support tickets, sales calls, and social comments.
We usually look for repeated phrases like “not clear,” “hard to reach,” “poor quality,” “misleading,” or “didn’t match expectations.” These patterns can show you where the trust gap is coming from.
14. Brand Associations
Brand associations measure the words, ideas, emotions, and attributes people connect with your brand.
This helps you see whether your positioning is landing the way you intended. You may want people to see your brand as premium, reliable, innovative, affordable, expert-led, or easy to use. Brand association research shows whether those ideas are actually showing up in the market.
How to Measure It
You can measure brand associations through:
- Open-ended survey questions
- Word association tests
- Social listening
- Review mining
- Customer interviews
- Focus groups
- Sales call feedback
- Comment analysis across social and ad platforms
Example Survey Questions
You can ask questions like:
- “What three words come to mind when you think of [brand]?”
- “What do you associate most with [brand]?”
- “How would you describe [brand] to someone else?”
- “Which of these words best describes [brand]?”
What to Use this Metric for
Brand associations can help you evaluate:
- Positioning
- Messaging
- Category fit
- Differentiation
- Reputation
- Emotional connection
If people describe your brand in a way that does not match your intended positioning, your messaging may need work. We recommend looking at the repeated words first because they show which ideas your audience has already attached to the brand.
15. Brand Equity
Brand equity measures the total value your brand adds beyond the product or service itself.
It shows how much strength your brand has built over time. When brand equity is strong, people may choose you even when competitors offer similar features, lower prices, or faster promotions. They trust the name, the experience, and the promise behind the brand.
Indicators of Brand Equity
You can look at signals like:
- Price premium
- Customer loyalty
- Market share
- Brand preference
- Perceived quality
- Advocacy
- Lower acquisition cost
- Higher customer lifetime value
How to Measure It
You can measure brand equity through:
- Brand valuation studies
- Pricing power analysis
- Preference studies
- Customer lifetime value
- Market share trends
- Competitive win rates
- Repeat purchase or renewal behavior
- Referral and advocacy data
Why it Matters
Brand equity helps you understand whether your brand is creating business value over time.
For example, if customers are willing to pay more for your product, renew without heavy discounting, recommend you to others, or choose you over cheaper alternatives, your brand is doing more than driving awareness. It is adding measurable value to the business.
If your brand equity is weak, we suggest looking at pricing power, customer loyalty, perceived quality, and preference first. These areas can show whether the brand has enough trust and differentiation to support long-term growth.
How to Act on Brand Health Data
Once you know which metric is weak, the next step is to connect that signal to other metrics and a clear action. Use this quick guide to decide what to review first:
What to Review Based on Brand Data Signals
| If the Data Shows... | Start Here |
|---|---|
| Reach is growing, but awareness is flat. | Review brand cues, message repetition, and creative consistency |
| Awareness is strong, but consideration is weak. | Review positioning, proof points, comparison pages, and case studies |
| Engagement is strong, but purchase intent is weak. | Review the offer, landing page, pricing clarity, and CTA flow |
| Visibility is rising, but sentiment is falling. | Review complaint themes, reviews, comments, and support tickets |
| Acquisition is strong, but retention is weak. | Review onboarding, customer success, product experience, and post-purchase communication |
| Consideration is strong, but preference is weak. | Review competitor messaging, objections, guarantees, and social proof |
| Trust is weak across segments. | Review transparency, review quality, support experience, pricing clarity, and public feedback |
Brand Health Benchmarks: What Good Looks Like
There is no single “good” brand health score that works for every business. A strong benchmark depends on your market, audience, category, and how you collect the data.
Benchmarks can vary based on:
- Industry
- Market maturity
- Brand size
- Geography
- Audience type
- Survey methodology
- Marketing channel
- Competitor set
This is why your benchmarks should give context, not fixed rules. For example, a 30% awareness score may be strong for a new B2B brand entering a niche market, but weak for a well-known consumer brand in a mature category.
That said, here are some stats you may find interesting:
Brand Awareness Benchmarks
- Unaided (spontaneous) recall: Established brands typically see unaided recall rates of 20–30%; newer brands fall in the 5–15% range, according to Umbrex.
- Aided recognition: Established brands typically land between 60–80% recognition when prompted with a logo or name; newer brands are closer to 30–50%. Unaided awareness above 50% is considered good; above 70% indicates excellent brand recognition and strong market presence, also according to Umbrex.
- Ad-driven awareness lift: Unaided awareness is the hardest brand metric to move; a typical ad campaign delivers just a 0.30-point lift. Mid-funnel metrics like favorability and purchase intent are bigger movers, with brand favorability shifting about 3 points after a typical campaign, as per Disqo.
Share of Voice Benchmarks
- Market leadership target: According to Intently, the average SOV for the leading brand across major industries was 28%, with the top three brands collectively capturing about 65% of all mentions.
- Industry SOV ranges: Travel industry SOV for leading brands ranges from 25–40%; healthcare brands typically fall between 15–30%; food and beverage brands average 10–20%, as per another Umbrex article.
- CPG leaders: Leading CPG companies frequently achieve 25–30% SOV to establish category dominance; for e-commerce stores, even 10% represents significant visibility against competitors, says Opensend.
Net Promoter Score Benchmarks
- Cross-industry B2C range: Average NPS scores for B2C industries range from 26 to 68; for B2B industries, the range is 41 to 68, as per Retently.
- Global scale: A score of 50 is classified as excellent; 70+ is considered world-class, according to ClearlyRated.
- Selected industry averages (SurveySensum, 2024): Insurance: ~80; Retail: ~64; E-commerce: ~52; Healthcare: ~46; SaaS/Software: ~40; Communications: ~30; Internet software & services: ~16.
- Regional context: According to Merren, North American (U.S. & Canada) averages run slightly lower at 35–40 due to higher consumer expectations; European averages sit around 25–35, partly influenced by cultural skepticism and stricter data privacy norms.
Customer Satisfaction Score Benchmarks
- Cross-industry average: According to Sobot, the average CSAT score across all industries is 78%.
- General thresholds: 75–85% is broadly considered a "good" score; above 90% puts a brand in the top 5% of companies, as per Armatis.
- By industry (ACSI / Retently data): SurveySparrow notes that healthcare averages around 80% (ACSI 2024–2025); SaaS targets 78–80%; retail ~76%; ISPs lag at 68%.
- Social media: According to Fullview, Social media platforms register some of the lowest customer satisfaction scores, averaging only 73.
The Best Types of Brand Health Benchmarks
To get a clearer view, our team at 9AM compares brand health metrics from a few different angles.
Internal Benchmarks
Internal benchmarks compare your current performance against your own past performance.
They help you answer questions like:
- Is awareness improving quarter over quarter?
- Is sentiment getting stronger after product updates?
- Is NPS moving up or down after onboarding changes?
- Is branded search growing after a campaign?
This is usually the best starting point because it shows whether your brand is improving over time.
Competitive Benchmarks
Competitive benchmarks compare your brand against direct competitors.
They help you see whether you are gaining or losing ground in the market. For example, your awareness may be growing, but if competitor awareness is growing faster, you may still be falling behind.
Use competitive benchmarks for:
- Positioning
- Share of voice
- Share of search
- Brand preference
- Market visibility
- Win/loss analysis
Industry Benchmarks
Industry benchmarks compare your performance against category norms.
These are useful for executive reporting and goal setting, but they need context. Survey methods, audience quality, sample size, and region can change the meaning of the numbers.
For example, NPS, CSAT, retention, and purchase intent can look very different across SaaS, ecommerce, healthcare, finance, and consumer brands.
Campaign Benchmarks
Campaign benchmarks compare brand health before and after a specific campaign.
They help you see whether a campaign improved awareness, recall, consideration, sentiment, or purchase intent.
For example, after running Meta campaigns, YouTube Ads, TikTok campaigns, or a larger performance marketing push, you can compare:
- Brand awareness before and after the campaign
- Ad recall after exposure
- Branded search lift
- Purchase intent among exposed audiences
- Sentiment changes during the campaign period
How Often Should You Measure Brand Health?
Most brands should measure brand health quarterly, while tracking faster-moving signals like sentiment, reviews, share of voice, branded search, and direct traffic monthly. A full brand health audit can be done once or twice a year.
The right cadence depends on the metric. Some signals change quickly, while others need more time to show meaningful movement.
Recommended Brand Measurement Cadence
| Cadence | Best For | Why It Matters |
|---|---|---|
| Weekly |
Social sentiment
Mentions
Review spikes
Reputation issues
|
Helps you catch sudden changes before they become bigger problems |
| Monthly |
Share of voice
Branded search
Direct traffic
Website engagement
|
Shows whether visibility and demand are moving in the right direction |
| Quarterly |
Brand tracking surveys
Awareness
Consideration
Preference
Purchase intent
|
Gives you enough time to see meaningful movement in perception and demand |
| Biannually |
Competitive brand health studies
Category perception
Trust analysis
|
Helps you compare your brand against competitors with more context |
| Annually |
Full brand audit
Brand equity review
Executive benchmark report
|
Gives leadership a clear view of long-term brand strength |
For most marketing teams, a quarterly brand health survey paired with monthly search, sentiment, and visibility tracking gives a practical rhythm.
You do not need to measure every metric every week. Start with the signals that match your current goals. If awareness is the priority, watch recall, share of search, and branded traffic. And if retention is the priority, focus on NPS, CSAT, churn, reviews, and customer feedback.
The goal is simple: measure fast-moving signals frequently, and review deeper brand perception metrics on a longer cycle.
Brand Health Metrics by Business Type
The right brand health metrics depend on how your business sells, how long the buying cycle is, and what customer behavior matters most. A B2B software company, an e-commerce brand, and a consumer brand will not read brand health the same way.
You can use the sections below to choose the metrics that match your business model.
B2B Brand Health Metrics
For B2B brands, brand health is closely tied to trust, recall, and whether the right accounts see you as a credible option.
Track:
- Brand recall among target accounts
- Consideration among buying committees
- Share of search
- Analyst and review site sentiment
- Pipeline influence
- Win rate
- Customer advocacy
- Referral quality
- Sales conversation themes
These metrics matter because B2B buyers usually compare several vendors before making a decision. If your brand is known but does not make the shortlist, you may need stronger positioning, clearer proof points, or better category visibility.
SaaS brand health metrics
For SaaS brands, brand health connects closely with product experience, retention, and customer trust.
Track:
- NPS
- Product sentiment
- Churn
- Expansion revenue
- Review ratings
- Community engagement
- Branded search
- Customer onboarding feedback
- Feature-level feedback
If branded search is rising but churn is also rising, your demand may be growing faster than customer satisfaction. This is a sign to review onboarding, product expectations, support, and post-sale communication.
E-commerce Brand Health Metrics
For e-commerce brands, brand health shows whether customers trust you enough to buy, return, and recommend.
Track:
- Repeat purchase rate
- Review sentiment
- Social reach
- Direct traffic
- Branded search
- Customer lifetime value
- Referral rate
- Cart behavior
- Post-purchase feedback
If your video ad performance, hook rates, and CTR look strong but repeat purchase is low, your campaigns may be attracting buyers who do not stay. We usually look at product quality, delivery experience, reviews, and post-purchase messaging first.
Consumer Brand Health Metrics
For consumer brands, brand health depends on awareness, emotion, visibility, and preference.
Track:
- Awareness
- Recall
- Preference
- Purchase intent
- Share of voice
- Sentiment
- Loyalty
- Brand associations
- Social proof
Consumer buyers may move faster than B2B buyers, so signals like recognition, sentiment, reviews, and purchase intent can tell you a lot about how your brand is performing in the market.
Turn Brand Health Insights into Growth with 9AM
Brand health is strongest when you measure it as a complete picture instead of a single score. Start with the metrics that match your current goals, set clear benchmarks, track changes over time, and use the data to improve your messaging, customer experience, creative strategy, and long-term growth.
Key takeaways
- Brand health shows whether people know, trust, consider, choose, and recommend your brand.
- Sales, traffic, video views, and conversion rates do not show the full picture of brand strength.
- Awareness, recall, and recognition help you measure how memorable your brand is.
- Sentiment, trust, and associations show how people feel about your brand.
- Share of voice and share of search help you compare brand visibility against competitors.
- Consideration, preference, and purchase intent show whether awareness is turning into buying interest.
- NPS, CSAT, loyalty, and retention reveal whether customers are satisfied enough to stay and recommend you.
- Strong benchmarks should combine historical, competitive, industry, and campaign data.
If you are looking to connect brand health with creative performance and customer data, 9AM can help you build a clearer measurement framework. As a performance marketing agency in New York, we help brands turn marketing data into sharper decisions across campaigns, channels, and growth strategy.
Book a strategy call with us to see where your brand health and performance data can work better together.
FAQs
What are brand health metrics?
Brand health metrics show how well your brand is known, trusted, considered, preferred, and recommended by your target audience. Common metrics include awareness, recall, sentiment, share of voice, share of search, consideration, preference, NPS, CSAT, retention, and brand trust.
What is the most important brand health metric?
There is no single best brand health metric. If you are building visibility, track awareness, recall, and share of search. If people know you but are not buying, track consideration, preference, purchase intent, and trust. And if you want to measure customer strength, track NPS, CSAT, retention, churn, and referrals.
How to measure brand awareness?
You can measure brand awareness through aided awareness surveys, unaided recall surveys, top-of-mind awareness questions, branded search volume, direct website traffic, social mentions, and share of search. A simple question to ask is: “Which brands come to mind when you think of [category]?”
How to measure brand sentiment?
You can measure brand sentiment by reviewing social mentions, customer reviews, survey responses, support tickets, media coverage, and comments on ads or organic posts. Classify mentions as positive, neutral, or negative, then look at the repeated themes behind the score, such as pricing, support, product quality, delivery, or messaging.
What is the difference between brand health and brand tracking?
Brand health is the current condition of your brand. It shows whether people know, trust, consider, choose, and recommend you. Brand tracking is the ongoing process of measuring those signals over time through surveys, search data, social listening, reviews, CRM data, and customer feedback.
How can 9AM help measure brand health?
At 9AM, we help brands move from scattered reports to a clearer brand health measurement setup. We define the right metrics, organize data from different channels, build dashboards, and turn the findings into practical marketing decisions.
Appendix
- https://www.edelman.com/trust/2025/trust-barometer/special-report-brands
- https://www.forbes.com/councils/forbesagencycouncil/2025/09/03/assessing-brand-health-a-practical-checklist-for-b2b-marketers/
- https://www.pwc.com/ng/en/assets/pdf/experience-is-everything.pdf
- https://www.nielsen.com/news-center/2025/nielsen-releases-its-2025-annual-marketing-report-looking-at-the-power-of-data-driven-marketing/
- https://agency.googleblog.com/2015/03/measuring-impact-of-youtube-ads-on.html
- https://brandstrat.co/wp-content/uploads/2021/12/The-Consumer-Decision-Journey.pdf.pdf
- https://www.netpromotersystem.com/about/measuring-your-net-promoter-score/
- https://www.surveymonkey.com/learn/customer-feedback/what-is-good-csat-score/
- https://www.pwc.com/us/en/library/trust-in-business-survey/customer-trust-in-your-sector.html
- https://umbrex.com/resources/ultimate-guide-to-company-analysis/ultimate-guide-to-marketing-analysis/brand-awareness-analysis/
- https://resources.disqo.com/industry-level-differences-in-brand-lift-and-outcomes-lift
- https://intently.ai/blog/calculating-share-of-voice
- https://umbrex.com/resources/ultimate-guide-to-company-analysis/ultimate-guide-to-marketing-analysis/share-of-voice-analysis/
- https://www.opensend.com/post/social-share-of-voice-sov-statistics-ecommerce
- https://www.retently.com/blog/good-net-promoter-score/
- https://www.clearlyrated.ai/industry-benchmark/nps-benchmarks-for-the-it-services-industry
- https://www.surveysensum.com/blog/nps-score-by-industry
- https://merren.io/what-is-a-good-net-promoter-score-2/
- https://www.sobot.io/article/csat-survey-benchmarks-top-industries-2025-comparison/
- https://www.armatis.com/en/2026/01/16/what-is-a-good-csat-score-discover-your-industry-benchmarks/
- https://surveysparrow.com/blog/csat-benchmarks/
- https://www.fullview.io/blog/csat-benchmarks-by-industry