Most campaign teams look at marketing dashboards every day. However, only a few teams change campaign decisions because of what they see.
What usually happens is familiar. Someone flags a dip in website traffic or Click-Through Rate. Another person questions attribution across paid advertising and social media. A third suggests waiting a few more days “to see if it stabilizes.”
Meanwhile, spend keeps flowing, creatives keep serving, and conversion rates quietly slip.
Modern marketing teams are dealing with an explosion of data. According to a Supermetrics 2025 data report, marketers work with 230% more campaign data than in 2020.
A weekly operating cadence gives marketing dashboards a clear role. It sets a shared rhythm for reviewing performance, calling exceptions, assigning owners, and committing to actions that ship within days, not weeks.
Next, we’ll break down how to build that cadence, so dashboards stop being passive reports and start driving weekly campaign decisions.
P.S.: If your team has dashboards but struggles to turn them into consistent decisions, 9AM Agency helps you build weekly operating cadences that connect your data to clear and actionable steps.
TL;DR
If you're running low on time, here are the highlights:
- Most teams are overloaded. Marketers are handling 230% more data than they were in 2020, and 56% struggle to find enough time to analyze it effectively.
- Reporting is too slow for how fast budgets move. 32% review marketing reports once a month or less.
- Data trust breaks the whole loop. Results say only 9% trust their data enough for accurate reporting, and 34% have already seen revenue loss due to fragmented customer data.
- The cadence that works is simple: a weekly campaign review to handle exceptions and commit actions, a monthly review for trend and mix shifts, and a quarterly review for bigger bets and guardrails.
- Dashboards only drive outcomes when every KPI has three things attached to it: a trigger, a decision owner, and a playbook. Otherwise, you get more charts and the same problems next week.
Why Marketing Teams Need an Operating Cadence
Dashboards aren’t the problem. The real issue is how frequently teams actually use their data to steer campaigns before problems spread.
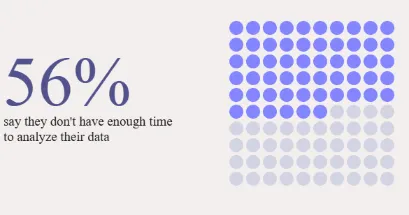
According to the same Supermetrics report, 56% of marketers say they don’t have enough time to analyze their performance data before issues escalate.
From what we’ve seen in day-to-day campaign operations, most teams lack a consistent rhythm that turns metrics into decisions. Data lives inside dashboards, but actions get delayed, debated, or deferred.
This gap leads to late reactions, missed opportunities, and performance that drifts without anyone catching it early.
We’ve also observed that time pressure isn’t the only blocker. The same report stated that 38% of marketers also struggle with fragmented reporting tools. Web analytics dashboards, social media analytics, CRM systems, and paid advertising platforms mostly live in silos, which makes it harder to identify clear signals across channels.
Worse, many teams move too slowly to respond at all. 32% only review performance reports once a month or less. This is far too infrequent to manage fast-moving campaigns, shifting trends, or changing budgets.
That’s why 58% of businesses now rely on data dashboards for daily decision-making, and instead of just reporting. When dashboards are already in daily use, adding a weekly cadence helps teams act faster and stay aligned.
Without that structure to connect insights to action, marketing teams end up with great data and no momentum.
We’ve learned that an operating cadence bridges that gap by turning raw metrics into repeatable decisions, before small problems turn into big ones.
The Weekly–Monthly–Quarterly Dashboard Rhythm That Works
Reviews don’t fix campaigns by themselves.
What fixes campaigns is knowing what signal you’re watching, when you act, and who owns that action.
From what we’ve seen working with different teams, problems start when performance conversations drift too far from action. If you wait for monthly decks to talk about performance, you’re behind before you begin. And if you sit in weekly meetings that rehash data but don’t output changes, you’re just busy.
In our daily practice, we use a simple operating rhythm with three clear layers:
- Weekly for exceptions and fixes.
- Monthly for trends and mix decisions.
- Quarterly for strategy and bets.
There’s also room for optional daily standups to unblock execution, but those aren’t the forums where spending decisions happen.
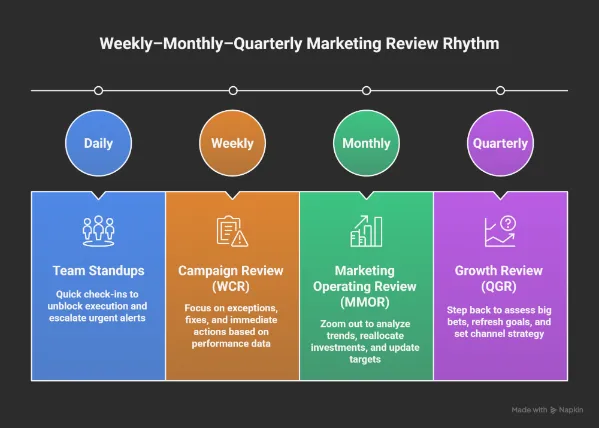
Weekly Campaign Review (WCR)
The weekly session is for those who indicate something has changed enough to act. In our experience, effective WCRs focus on a short list of indicators rather than broad reporting.
Here’s what people actually look at in a WCR:
- Spend pacing vs. plan.
- CPA / ROAS swings.
- CTR / CVR changes.
- Frequency and creative fatigue.
- Experiment signals that are trending early.
More importantly, we’ve noticed that strong WCRs always produce outputs. When teams leave without decisions, the meeting failed. And here’s what comes out of a working session:
- Pause or cut spending on underperformers.
- Swap or refresh creative.
- Reset audiences with new targeting.
- Schedule landing page tests.
- Assign owners and due dates for each action.
Remember that weekly reviews are where you catch what’s drifting and lock in the fix before it costs more.
Monthly Marketing Operating Review (MMOR)
Weekly snapshots see the trees, but monthly reviews see the forest.
In our experience working with different teams, the MMOR is where short-term noise gets separated from real patterns. We use this review in our daily practice to zoom out just enough to pressure-test performance without losing operational clarity. The focus typically includes:
The focus typically includes:
- Evaluate CPA / ROAS trends over time.
- Analyze cohort quality and downstream performance.
- Check attribution health and consistency.
- Roll up experiment learnings from the month.
- Compare actual results against the budget plan.
Outputs here look different. Instead of quick fixes, this is where you’ll reprioritize tests, reallocate investments across channels, and update targets for the next month.
If something looks like a longer-term pattern and needs a structural change, this is where you catch it.
Quarterly Growth Review (QGR)
Every quarter, you step back even more. The daily grind is over, and now you assess big bets. Our team uses this session to evaluate big bets and directional questions, including:
- Is CAC where it needs to be by segment?
- What’s the LTV trend telling us?
- Do we have incrementality signals that support more spending?
- What risks or competitive shifts are emerging?
What comes out of this review is alignment. In our experience, strong QGRs produce refreshed goals, clear budget guardrails, and a channel strategy that fits the next quarter’s priorities.
Daily Team Standups (Optional)
We recommend keeping daily standups light; it’s not a campaign review. The point is simple:
- What happened yesterday?
- What’s happening today?
- What’s blocking progress?
From what we’ve learned, daily standups work best as an early-warning system. If there’s an urgent alert that needs immediate attention, you catch it here and then push it to the weekly cadence with context.
How To Design Marketing Dashboards That Drive Decisions
Most dashboards resemble spreadsheets that have been mistaken for a performance system. They dump every number under the sun. That’s why most teams stare at them and still can’t act.
In our daily practice, we design dashboards with one rule in mind: if it doesn’t influence what happens next week, it doesn’t belong. Our team uses a decision-first approach, where every chart exists to answer a specific question or trigger a specific action.
If a dashboard is going to drive decisions, it needs three things:
- Clarity on what each chart signals.
- Defined thresholds that tell you when to act.
- Clear ownership so the next move is never ambiguous.
A useful dashboard is one you can scan and know exactly what to do next. Trust us, teams move faster when dashboards reduce debate instead of creating it.
Clarity doesn’t just mean clean visuals; it means everyone agrees on what the numbers mean.
62% of marketers only moderately trust their performance metrics, and more than half say that their performance hasn’t improved. A dashboard loses its power if the team questions the data behind it.
That’s why we recommend setting the rules before starting. Define metric ownership, data sources, and decision thresholds upfront. When the foundation is clear, dashboards stop being reports and start functioning as operating tools.
Core Traits of a Decision-First Marketing Dashboard
Now you must be wondering what actually sets a decision-first dashboard apart?
From our experience working with different teams, the difference is not tooling or design polish. Instead, it’s intent. In our daily practice, we design dashboards around decisions first, then add metrics only if they support a clear action.
A decision-first dashboard consistently shows a few defining traits:
- One view per goal or decision area. Don’t mix acquisition and funnel in the same chart.
- Clear targets with thresholds. You should be able to see at a glance if performance has triggered a rule.
- Exceptions need to stand out. Use color, flags, or labels; whatever helps the team spot issues fast.
- No mixed objectives in one view. If it doesn’t tie to a clear action, it doesn’t belong here.
We’ve observed that dashboards showing dozens of metrics without triggers become passive quickly. A dashboard that shows 100 metrics but no triggers is just a museum of numbers.
Key Insight: The Supermetrics 2025 report also stated that 66% of marketers report difficulty tracking users across channels. That’s why dashboards should integrate cross‑channel signals and focus on actionable changes.
Separate Dashboards for Acquisition, Funnel, Creative, and Budget
Dashboards work when they answer one question: What am I changing this week?
So break them down by decision area:
Acquisition:
- Metrics: Reach, CPM, CTR, CPC, CVR, CAC.
- Purpose: Identifies where top-of-funnel performance is gaining or losing momentum.
Funnel:
- Metrics: Step conversions, drop-offs, and time to convert.
- Purpose: Highlights where users are exiting before completing key actions.
Creative:
- Metrics: Hook engagement, retention signals, and CTR decay.
- Purpose: Detects early signs of creative fatigue based on interaction patterns.
Budget pacing:
- Metrics: Spend vs. plan, marginal Return on ad spend (ROAS), forecast.
- Purpose: Budget tracking should show when performance starts lagging behind investment, so you can make timely adjustments.
Separate views make it easier to ask the right question each week: Is this good enough to keep running, or do we act?
Key Insight: In 2025, over 50% of marketers cut their ad budgets due to economic pressure. That makes its slow reviews riskier, leading to wasted spend and missed chances to improve performance.
How To Turn Marketing Dashboards Into Weekly Campaign Decisions
Looking at data isn’t the same as acting on it.
Weekly cadence turns reporting into a system: you catch the right signal, make a clear decision, and track the follow-through.
Here’s how you turn a passive dashboard into a practical control loop:
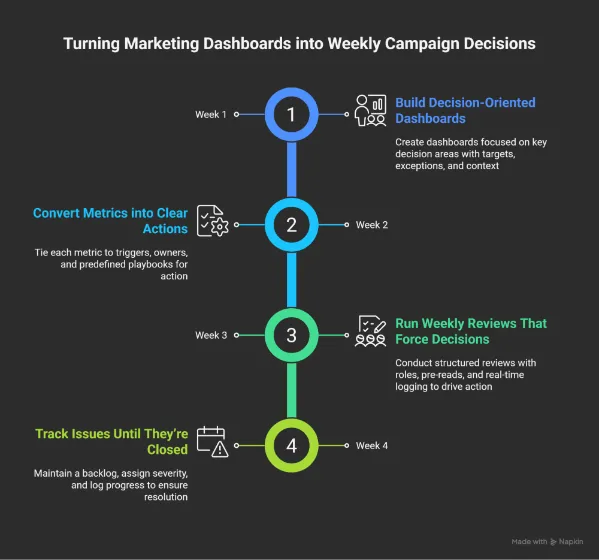
1. Build Decision-Oriented Marketing Dashboards
Dashboards only work if they help answer two questions quickly. In our daily practice, our team does not ship a dashboard unless both are immediately clear:
- What changed?
- What are we doing next?
From what we have learned, dashboards lose effectiveness when they try to support too many decisions at once. We recommend assigning each dashboard a single purpose. Focus it on one decision area: acquisition, funnel health, creative, or budget pacing, to keep it clean and actionable.
Make sure each chart has:
- A clear target and action threshold.
- Exceptions highlighted visually.
- Enough context to understand trends at a glance.
Keep in mind that the dashboard should be practical. It has to guide the team on what to adjust, stop, or scale next.
2. Convert Metrics Into Clear Actions
Metrics only create value when they drive action. From what we have seen, teams struggle not because they lack data, but because they have not decided in advance how they will respond to it.
Every key metric should be tied to:
- A trigger condition that signals when attention is required.
- A clear decision owner responsible for the response.
- A predefined playbook that removes guesswork.
In our daily practice, our team documents these rules before dashboards go live. This approach ensures that weekly reviews focus on execution instead of debate.
Here are a few real examples that show how this looks in action:
- ROAS drops below target for 3 consecutive days → Reduce spend on affected ad set.
- Frequency climbs past 5, and CTR is declining → Refresh or rotate creative.
- Landing page CVR falls more than 20% week over week → Run a variant test.
- CPL rises, but SQL rate is improving → Hold spend, review targeting alignment.
Without these rules, teams drift into “let’s monitor it” territory. With them, action becomes default.
3. Run Weekly Reviews That Force Decisions
Weekly reviews only work when they are designed for action. We have noticed that meetings fail when roles are unclear, and discussions drift without resolution.
The weekly review should operate as an active problem-solving forum. Each participant has a specific role to move decisions forward:
- A chair keeps time and pushes for a decision on each exception.
- A scribe logs outcomes in real time, with owners and due dates.
- Each owner confirms what they’re doing and by when.
- Pre-reads are sent ahead, so live time is used to act and not just explain.
If you’ve sat through a 60-minute review and left with no actions, this structure changes that. When roles and outputs are explicit, decisions happen quickly and accountability holds.
4. Track Issues Until They’re Closed
A decision made once isn’t enough. You need a system to hold the thread:
We recommend the following structure:
- Maintain a backlog tied directly to dashboard exceptions.
- Add severity tags and response SLAs (e.g., urgent = same day, standard = next WCR).
- Log every issue with its trigger, owner, action, and close date.
No more “Wasn’t this flagged last week?” If it came up, it should either be fixed or moving toward resolution. Trust us, this step is what turns weekly decisions into sustained performance improvement.
How 9AM Agency Uses Dashboards in Weekly Campaign Reviews
Let’s explore how our team at 9AM runs campaign reviews week to week, based on client priorities and signal quality.
Weekly Focus Areas
Different clients call for different cadences, but some review areas stay consistent. These are the key signals the we look at across accounts:
- Spend pacing: Always checked to ensure budgets align with plan.
- Creative signals: Reviewed bi-weekly or monthly, depending on volume and fatigue risk.
- Full-funnel metrics: Reviewed weekly or monthly, depending on client objectives.
- Blended performance month-to-date: Consistently reviewed across accounts.
For clients focused on new user acquisition, our team prioritizes a tighter set of leading indicators with clear triggers:
- New customer orders (down >15% over 7–14 days = trigger).
- CPA (up >15% over last 7 days = trigger).
- ROAS (drops >25% over the last 7 days or month-to-date = trigger).
- CTR (drops >25% over 7–14 days = trigger).
- CVR (drops >10% = trigger).
Each of these comes with a standard response pattern to reduce reaction time.
Decision Patterns by Trigger
The value of a cadence shows up in how fast decisions get made when a trigger hits.
Here’s how our team typically responds based on the signal pattern:
If CPA spikes:
- Pause low-performing ad sets.
- Shift budget toward stronger segments.
- Tighten audience targeting.
- Review bidding strategy.
- Check for external shifts like seasonality or competition.
If ROAS drops:
- Pause campaigns below the efficiency threshold.
- Identify if the drop is platform-wide or isolated.
- Review changes in product, pricing, or promo.
- Shift budget into high-performing campaigns or channels.
If new user orders fall:
- Increase top-of-funnel investment.
- Launch fresh prospecting assets.
- Refresh creatives.
- Test new offers or incentives for first-time buyers.
If CTR drops:
- Reduce spending on stale ads.
- Deploy backup creatives.
- Adjust frequency caps.
- A/B test new headlines, visuals, or CTA angles.
If CVR falls:
- Check for technical issues (site, forms, checkout).
- Audit funnel analytics for drop-off points.
- Align landing messaging to ad intent.
- Trigger cart abandonment sequences.
Weekly reviews at 9AM are built to support quick decisions. Our team doesn’t use these sessions to recap what already happened.
Everyone shows up ready to act, with clear metrics to monitor and steps to take. That’s what keeps progress from stalling.
Operating Documents That Support Your Operating Cadence
Dashboards and meetings work better when backed by clear documentation.
This kind of support helps us maintain consistency in our decision-making. It also ensures that each action is followed through properly.
Goals and scorecards:
- Each quarterly goal maps to a weekly scorecard.
- One owner per KPI.
- Weekly targets are defined upfront.
- Signals and thresholds are set early.
This turns broad objectives into concrete weekly actions.
Decision logs linked to dashboards:
- Every dashboard exception should have a linked decision record.
- A clear log includes:
- Date and context.
- Options reviewed.
- Final decision.
- Assigned owner.
- Review date.
Connect each log to the relevant dashboard view and task in your tracker.
Campaign run books and playbooks:
These docs outline how to respond to recurring situations:
- Creative fatigue.
- CPA creep.
- Targeting issues.
- Landing page drop-offs.
They save time by offering proven steps for familiar problems.
Scorecards, logs, and run books work together as the operating layer. They help keep the team aligned and prepared to act consistently.
A Practical 90-Day Rollout Plan You Can Execute
Starting a weekly cadence across the entire team at once can feel overwhelming.
In our experience working with different organizations, a 90-day rollout helps test the system with a few campaign pods, refine what works, and scale only when it’s proven.
Let’s see how that works:
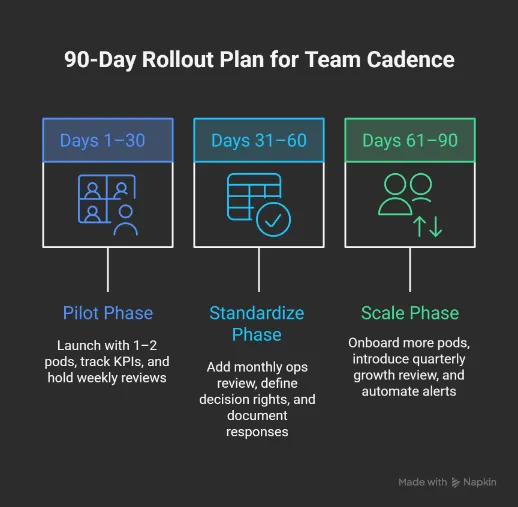
Days 1–30: Pilot
The first month is about focus and learning. So, keep it simple.
We recommend the following setup:
- Start with one or two pods that already track core metrics.
- Pick 5–7 KPIs per goal, tied directly to real outcomes (e.g., CPA, ROAS, new orders).
- Assign an owner to each metric and define the thresholds that trigger action.
- Set a recurring weekly campaign review (WCR) focused on exceptions, not updates.
The goal here is to get the cadence running and confirm it supports real decisions.
Days 31–60: Standardize
Once it’s working in real cycles, lock in the structure.
From what we have observed, this phase is where operating discipline forms. Teams move from experimentation to consistency.
Key actions in this stage include:
- Add a monthly marketing ops review (MMOR) to evaluate trends and mix decisions.
- Define decision rights: who can move budgets, pause ads, or launch new assets.
- Document standard responses to common triggers (e.g., CTR drops, CPA spikes).
- Adjust dashboards based on what’s actually been useful in meetings.
By now, the cadence should feel embedded in the workflow rather than layered on top of it.
Days 61–90: Scale
The final phase is about expansion without losing clarity.
We believe teams scale successfully only after the cadence feels routine for the pilot group. At this stage, we recommend:
- Onboard additional pods and channels into the weekly loop.
- Introduce a quarterly growth review (QGR) to adjust direction.
- Eliminate meetings that the cadence replaces.
- Automate key alerts for performance drops or pacing issues.
By day 90, your cadence should feel natural, drive better decisions, and help teams coordinate without friction.
Tools You Need for a Decision‑Led Marketing Dashboard Cadence
The operating cadence works when your tools help teams make timely decisions, take action quickly, and stay aligned.
It’s less about adding more software and more about using your current setup with purpose.
Here’s how to make your tools work for it:
Data Infrastructure
You need reliable signals and clean data flows, like:
- Pipelines with enough validation to catch errors before they impact decisions.
- Automated alerts for performance shifts (e.g., CTR decay, CPA spikes).
- Dashboards that highlight exceptions, not just surface numbers.
- One canonical source for metric definitions and performance history.
- Templates are designed around specific decision areas and not generic reports.
If each pod sees a different version of the same number, nothing moves forward.
Work Management
This is where decisions become action:
- One system to log decisions and assign follow-ups.
- Required fields for owner, due date, current status, and next step.
- Tasks generated directly from dashboards or alerts.
- Urgency tags that highlight what needs attention this week.
- Saved views for WCRs, MMORs, and QGRs, so teams don’t lose time searching.
It’s how individual accountability becomes visible.
Structured Communication
The focus is on a clear and shared understanding across the team:
- Pre-read docs so meeting time is used for action, not explanation.
- Decision summaries are shared in team channels, linked to tasks or follow-up.
- A shared wiki for templates, logs, and tactical guidance.
- Onboarding checklists, so new hires understand how the system works from day one.
This keeps the cadence intact even when people rotate or teams scale.
Common Cadence Pitfalls and How to Fix Them
Even with a solid setup, it’s easy for weekly reviews to lose focus. We have observed that these minor issues accumulate quietly, and over time, they make it harder to transition from insight to action.
Here are some of the most common pitfalls and what to do instead:
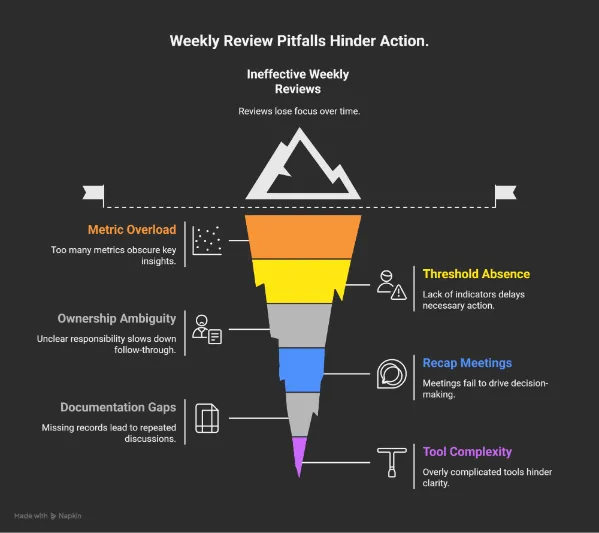
- Too many metrics per view: When everything is on display, it becomes harder to spot what really matters.
What to do: Focus each dashboard on a specific goal. Keep the metrics tight and relevant to the decision at hand.
- No thresholds or triggers: Without clear indicators, teams are unsure when a metric requires attention.
What to do: Set visible thresholds for key metrics. This helps everyone spot when action is needed.
- Unclear ownership: If it’s not clear who’s responsible, follow-through slows down.
What to do: Assign each key metric to one person. That clarity speeds up reactions and builds accountability.
- Meetings that recap instead of resolve: Updates alone don’t move the work forward.
What to do: Use meeting time to make decisions. Come prepared to suggest actions, not just report on outcomes.
- Missing documentation: Without a record, it’s easy to lose track of past decisions or repeat old conversations.
What to do: Keep a shared log of decisions. Link them to dashboards and tasks so context stays accessible.
- Tools that complicate more than they help: More data isn’t always better if it adds noise instead of clarity.
What to do: Build dashboards around real decisions. Keep each tool purposeful and easy to navigate.
These adjustments don’t require major changes. A few focused improvements can make reviews more effective and help the team act with more confidence.
Adapting The Cadence For Remote And Hybrid Teams
Weekly rhythms don’t scale by copying in‑office habits. Remote and hybrid teams face timing, visibility, and asynchronous collaboration challenges that need specific practices.
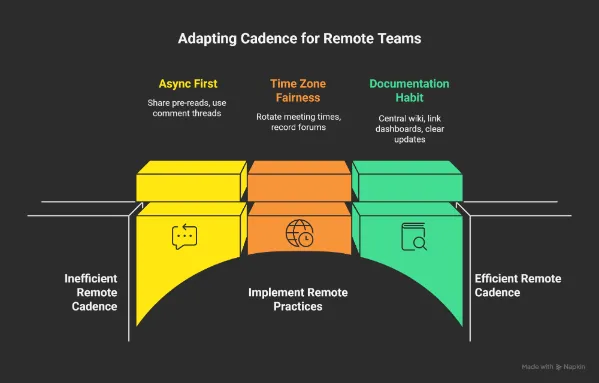
Async First
Working across time zones means not everyone can join a call at the same time.
- Share digestible pre‑reads early, so decisions aren’t held up by timezone gaps.
- Use async comment threads on dashboards and logs, so questions get answered before the life review.
- Reserve live time for decisions that need real‑time alignment and not data explanation.
Time Zones and Fairness
Remote teams span regions, and your schedule should reflect that reality.
- Rotate meeting times if members are spread across zones.
- Record critical forums with clear timestamps and summaries.
- Publish decision outcomes quickly so late attendees can sync up without guesswork.
Documentation as a Habit
Remote work thrives on written context, that’s why:
- Keep decisions and playbooks in a central and searchable wiki.
- Link every dashboard view to its logs and tasks.
- Encourage short, clear updates over long monologues.
This makes the cadence easy to follow even when people aren’t in the same room, metaphorically or physically.
Build a Decision-First Marketing Dashboards With 9AM
Remember that, without structure, even the best dashboards end up as passive reports. But when reviews are focused, consistent, and tied to action, they become a system for continuous improvement.
This kind of cadence doesn’t require more tools or more meetings. It needs clarity: clear priorities, clear triggers, and clear owners. When those pieces are in place, teams are anticipated. They make changes when it counts, not weeks after the fact.
If your marketing feels like it’s running on autopilot but not improving, this is where to start. 9AM works with fast-moving brands to build dashboards, rituals, and decision frameworks that actually drive growth.
If you’re ready to turn reporting into results, we’d be happy to show you how we do it. Contact us!
FAQs
What is a Marketing Cadence, Exactly?
It’s a structured process for reviewing campaign data and performance insights on a regular schedule. Most marketing teams use a weekly cadence to monitor conversion rates, adjust customer acquisition efforts, and respond quickly to changes in website traffic or social media engagement.
Why Does a Cadence Matter if We Already Have Dashboards?
Web analytics dashboards or Google Analytics show the numbers, but dashboards without cadence become passive. A cadence ensures that social media metrics, Click-Through Rate trends, and bounce rate issues translate into decisions. It also helps align data integration from tools like CRM systems or email marketing platforms into one actionable routine.
Which Metrics Should be Reviewed Every Week?
It depends on your campaign mix. Most teams monitor Return on Ad Spend, CTR, CVR, and CPA across channels like Facebook Ads or Google Ads dashboards. If landing pages or SEO dashboards show changes in organic performance or lead generation trends, those are reviewed too. Social media posts and newsletter dashboards can also feed into this if part of your content marketing campaign.
Who Should be Involved in the Weekly Reviews?
Your digital marketers, performance leads, and media buyers, basically anyone who owns metrics tied to paid advertising, lead generation, or brand visibility. The goal is to bring together campaign owners across platforms like Google Search Console, Power BI, or your main intelligence platform to propose actions when shifts occur.
Do We Need Special Software to Run a Cadence?
No specialized software is required. However, teams with marketing data pipelines or data governance needs often benefit from structured tools that support consistent tracking. Using tracking parameters, central attribution models, and integrated dashboards helps keep all campaign metrics aligned and useful.
How do We Keep this Cadence Working Overtime?
Consistency and clarity. Refresh Marketing Dashboard Templates to reflect new goals. Align cadence rituals with your content ecosystem, and document learnings from the customer journey. The more your team works with shared context, the easier it is to keep weekly reviews valuable, even as your tools or platforms evolve.
How does 9AM Agency Help Teams Turn Dashboards into Weekly Decisions?
9AM designs decision-first dashboards and operating cadences that connect metrics to triggers, owners, and actions. We focus on weekly execution, not passive reporting.
What Makes 9AM’s Approach to Marketing Analytics Different?
We build analytics systems around decisions. Dashboards, attribution, and reviews are structured to support fast action, accountability, and continuous improvement.