

Growth is no longer funded on optimism. In 2026, every dollar must defend itself.
While your growth targets are aggressive, your CFO’s scrutiny may be even tighter. That said, this tension is common. On one hand, you need the budget to scale, but the finance wants payback clarity, cash efficiency, and forecast reliability.
You aren’t alone. 63% percent of marketing leaders report increased pressure from CFOs to prove the value of every dollar spent.
As marketing budgets dropped to just 7.7% of revenue in 2024, it’s clear that teams are forced to do more with less. You need to bridge the gap between growth-at-all-costs and financial discipline.
This guide will show you how to model unit economics that your finance team will actually trust.
P.S.: If you want board-ready metrics without the spreadsheet headaches, our expert team at 9AM can help validate your CAC payback and LTV model through a custom audit.
TL;DR
- Provide finance teams with data on cash flow, payback velocity, and net revenue retention. Move beyond vanity metrics like leads and likes.
- Ensure your models align with GAAP. These models must respect gross margin and true retention costs. Your reporting also needs to reflect the difference between revenue and profit.
- While the LTV is theoretical, the CAC payback period proves immediate capital efficiency. Prioritize the latter as it is your strongest argument for budget approval.
- Turn a skeptical CFO into an ally with rigorous, defensible data in your budgets.
The Finance Perspective: Why CFOs Scrutinize Marketing Data
While you speak the language of clicks, leads, and conversion rates, finance professionals speak of risk, liquidity, and cash flow. No wonder there’s a disconnect.
This happens when marketing reports success based on top-line growth, while the bank account shows a burn rate that threatens the business’s cash position.
In our experience working with growth and finance teams side by side, we’ve seen that this tension rarely comes from disagreement about ambition. It comes from disagreement about cash timing and payback visibility.
Finance departments scrutinize marketing budgets and data because they prioritize the ability to meet short-term obligations and ensure the sustainability of the business. This is more important to them than optimistic projections.
A business model’s viability relies on cash efficiency, especially given that 65% of startups fail due to cash issues.
Want to win the finance team’s trust?
Stop focusing on vanity metrics. And start reporting GAAP-aligned financial data that proves your marketing ROI contributes to the bottom line.
Here’s an interesting talk about the need for Marketing and Finance to stay in lockstep, particularly about tighter budgets, data rigor, and multi‑channel targeting:
CAC Payback Period: The Ultimate SaaS Cash Flow Metric
The CAC payback period is the metric that matters most to your CFO. Here’s what it is and what it entails.
What Is the CAC Payback Period?
The CAC payback period is the number of months required to break even on the cost of acquiring a customer, aka a measure of risk.
A shorter payback period means you replenish your cash balance faster, freeing up working capital to reinvest (which finance teams love). For growth-oriented startups, this velocity is the engine of compounding growth.
How to Calculate CAC Payback Period (Formula)
As shared earlier, you must use gross margin instead of revenue in your calculation. Here’s how to calculate how long it will take you to recover your sales and marketing spend.
Let’s look at an example of a SaaS company.
If your sales and marketing cost to acquire a customer is $12,000, and they pay $1,000/month (monthly recurring revenue) with an 80% gross margin, your calculation is:
Compared to average SaaS companies, which achieve payback in under 12 months, you’re lagging behind the competition.
And if you used revenue ($1,000) instead of gross profit ($800), you would incorrectly report a 12-month payback instead of 15 months. That 3-month gap is where you run out of cash. Plus, you’ll (incorrectly) think you’re on track.
Since finance teams need accurate data to make decisions on allocating financial resources, you could’ve given them the wrong information.
What Is a Good CAC Payback Period? Benchmarks
A great CAC payback period is 0–6 months. That’s the dream scenario and a clear sign your go‑to‑market engine is humming. However, anything under 12 months is still considered strong, as most companies land somewhere between 8.6 and 15 months, depending on their market. The real standouts hit payback in 6–9 months, especially if they’re running a product‑led motion.
On the flip side, enterprise deals naturally stretch things out, and it’s still perfectly healthy to last 12-18 months.
As per the data from Stripe, here’s a breakdown of good CAC payback periods depending on the type of business:
CAC Payback Period Benchmark As Per Business Stages
The “right” CAC payback period also depends on your business stage and access to capital. As companies mature, finance teams expect faster capital recovery and tighter acquisition discipline.
According to recent SaaS business benchmarks, top-performing companies recover costs in under a year. So if your CAC payback period is, say, 24 months or longer, you’re financing your customers. You’re not growing your business.
Why CFOs Prioritize a Short Payback Period
CFOs prioritize a short payback period under 12 months because it reduces financial risk, protects liquidity, and allows capital to be reinvested quickly. Shorter payback windows help companies stay flexible in uncertain markets and ensure investments generate returns before conditions shift.
Rapid capital recovery also shields the business from market downturns and unpredictable retention curves. Finance professionals value this discipline because it limits exposure and strengthens financial stability.
Effective Strategies to Reduce Your CAC Payback Period
Your CFO will love your marketing team if they follow these strategies to reduce your CAC payback period:
1. Accelerate Sales Cycles
Use interactive walkthroughs and self-service support to shorten the time from lead to close. The sooner you close deals and start billing, the sooner you recover acquisition costs and can re-spend that money on acquiring the next customer.
2. Upsell Early
Don't wait for month six to expand an account. Bundle additional seats or a premium customer success experience right at the point of sale to instantly increase your initial average revenue per user (ARPU). That higher upfront cash flow directly shrinks your payback timeline.
Here’s a quick tip on how to do that:
3. Optimize Onboarding
The high-risk window for churn is right after the credit card clears. Here, you need to shrink the gap between payment and actual usage. Instead of making new users read a boring PDF manual, use efficient in-app onboarding, like interactive walkthroughs or pre-loaded templates.
This will guide them to their first "win" in minutes. It’s vital to hook them on Day 1 to prevent early churn and secure your payback timeline.
Customer Lifetime Value (LTV): Modeling for Cash Flow
Now let's look at the value side. It’s easy to (unintentionally) inflate LTV. Here is how to calculate it defensibly.
What Is LTV Modeling?
LTV modeling is the process of estimating the total gross profit a business expects to earn from a customer over their lifetime. It incorporates revenue, gross margin, retention rate, churn, and expansion behavior to project long-term customer value.
Accurate LTV modeling helps finance teams assess capital efficiency, forecast cash flow, and determine sustainable customer acquisition spend.
How to Calculate LTV (The Gross Margin Method)
Finance will reject an LTV model based solely on revenue, so use gross margin.
For instance, if you sell a $10,000 subscription, but your cost of goods sold (i.e., server costs, support, onboarding, etc) is $4,000, your real value is $6,000.
Using the full revenue number artificially inflates your LTV:CAC ratio and sets you up for a budget slash later when cash flow doesn't match your projections. Plus, it could mislead stakeholders.
Impact of Churn and Retention on LTV Models
Customer lifetime is determined by churn. A small change in retention curves drastically alters LTV. So, you must differentiate between logo/customer churn (i.e., losing a customer) and net dollar retention (NDR).
Remember that if you retain customers but they downgrade their subscriptions, your LTV model crashes. Finance teams model conservatively because downside protection matters more than optimistic scenarios.
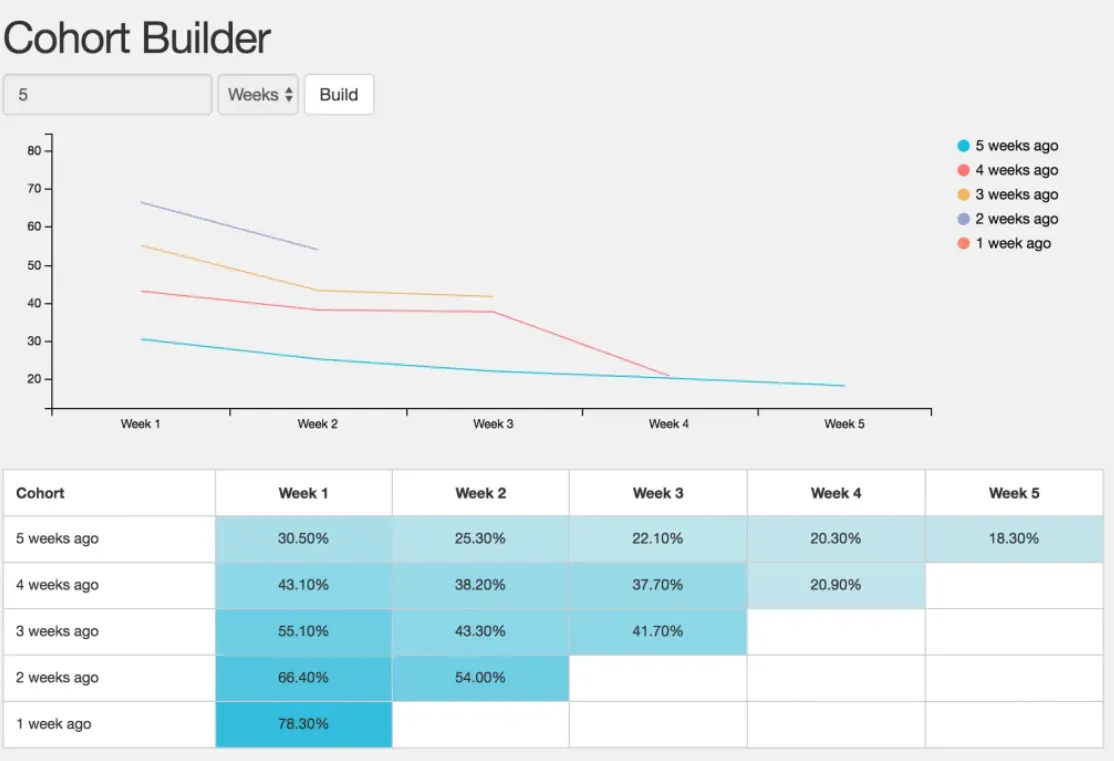
Let’s analyze this through cohorts first.
Cohort Analysis: Moving Beyond Average LTV
Averages don’t reveal the entire picture. A blended LTV of, say, $15,000 might hide the fact that your Q1 cohort is worth $25,000. In contrast, your Q3 cohort, acquired through a new, unproven marketing campaign, is churning out and is worth only $5,000.
Using average LTV calculations hides trends. To get a clearer picture, we suggest using customer segmentation to group users by sign-up month. This approach helps you see if your customer behavior is improving (or degrading) over time.
With this information, you’ll be able to kill bad channels that bring you and the finance team losses.
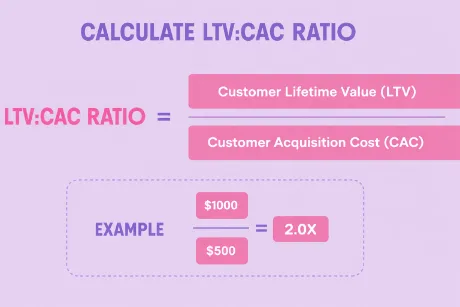
LTV:CAC Ratio: Measuring Sustainable Unit Economics
While payback measures risk, the LTV:CAC ratio tells you how much revenue you’ll make in the long run from your customers.
Understanding the LTV:CAC Ratio: A Measure of Profitability
The ideal LTV:CAC ratio for a healthy SaaS startup is 3:1, which is the industry benchmark. This ratio balances profitability with aggressive market share capture. Simply put, an LTV:CAC ratio of 3:1 means that your organization makes $3.00 for every $1.00 spent to acquire a customer.
Here’s a breakdown of the ratio guidelines for early-stage SaaS companies:
- LTV:CAC = 3:1: You’re efficient and profitable.
- LTV:CAC < 1:1: You’re losing money on every new customer (after overhead), as your organization struggles to monetize them.
- LTV:CAC > 5:1: You might be under-spending here. In fact, the finance department might actually tell you to spend more to grow your user base.
How to Model Your Expected LTV:CAC with Precision
To model this precisely, you need to apply a discount rate to future cash flows. Money today is worth more than money at the end of the year. This is known as the time value of money.
When you discount future LTV, you present a conservative number that respects the time value of money; this is a concept your CFO lives by.
Insider tip: Reach out to your finance team to establish what discount rate to use. They should have historical data that includes the Weighted Average Cost of Capital (WACC). This is usually the baseline discount rate for mature SaaS companies as it reflects:
- Debt costs
- Investor return expectations
- Company risk profile
For instance, early-stage startups may use higher proxy discount rates (15–30%+ annually).
Thus, when your CAC model matches the CFO’s valuation logic:
- Marketing forecasts become trusted
- Budget approvals get easier
- Performance conversations move from opinion → finance-backed strategy
Optimizing LTV:CAC: Growth Through Financial Levers
If your ratio is low, you don't always need to cut marketing spend. You can pull other financial levers:
- Strategic Pricing: A 10% increase in subscription prices drops straight to the bottom line. This improves the ratio instantly.
- Reducing Cost of Service: Reducing hosting costs or automating customer success increases the gross margin, which boosts LTV without requiring a single new lead.
For example, at 9AM, we supported Mogu Mogu’s entry into the U.S. market by building a localized micro-influencer network that reduced acquisition costs through engagement-efficient distribution. By achieving meaningful interactions, we improved capital efficiency without increasing spend intensity.
Insider tip: Note that a ratio under 1:1 indicates immediate cash burn and unsustainability. So, optimization is key.
Principles for Robust Financial Modeling
Your model is only as good as the infrastructure behind it. We’ll look at these next.
The Power of Cohort Analysis in Predictive Financial Modeling
Avoid the drama and move from static sheets to dynamic cohort analysis. You’ll find that tracking retention curves by signup month reveals hidden churn issues.
You’re basically mapping how long revenue actually sticks around, then projecting it forward using trends that match your historical behavior. It blows static churn formulas out of the water because it captures expansion, contraction, and the quirky decay patterns each cohort brings.
Data Preparation (the part most teams skip)
Start by pulling raw billing data: customer ID, signup date, monthly revenue from Stripe, HubSpot, or wherever your truth lives. Clean it up so you’re only looking at real, paying users.
Group customers into monthly cohorts (e.g., the Jan 2026 cohort) and track how many are still active and generating revenue each month after signup. This gives you that classic “triangle chart” of declining curves, your retention reality.
From there, LTV becomes simple math:
Sum up monthly revenue per starting customer × retention rate across the cohort’s lifetime, then adjust for gross margin and discount rate.
For example, you might see that customers acquired via content marketing have a 20% higher LTV than those from paid ads. With this insight, you can reallocate your budget to the highest-yield channels.
Check more info on how to keep CAC under control when scaling paid media
Finance will love this approach because it’s grounded in actual behavior, not theoretical churn shortcuts that fall apart the moment your retention wobbles.
Now, you can move to scenario planning.
Scenario Planning and Sensitivity Analysis
Never present one number; always present a range. Run a sensitivity analysis that covers the best, base, and worst-case scenarios. As per our experience working alongside growth and finance teams, it’s the fastest way to spot hidden risks, surface upside, and earn finance’s trust with transparent, spreadsheet‑friendly what‑ifs.
Ensure you consider the following:
- What happens to cash flow if CAC increases by 10%?
- And what if churn spikes to 5%?
Define Scenarios (your base reality vs. your extremes)
Start with a base case grounded in real cohort data: actual 12‑month retention, average CAC (say $2K), and gross‑margin MRR per user.
Then model:
- Optimistic version (+20% retention, -10% CAC) and
- Pessimistic one (‑20% retention, +20% CAC, -10% margin).
Document every assumption clearly to maintain analytical integrity.
Key Steps
- Input variables: List the drivers you’ll flex: churn ±15–25%, margin ±5–10%, CAC ±10–20%, discount rate 8–15%.
- Link to cohort model: Feed each scenario’s retention curve directly into your LTV math (e.g., base: 60% month‑12 retention; worst: 40%).
- Automate calculations: Use Excel data tables or Scenario Manager so payback updates automatically as cumulative gross‑margin MRR catches up to CAC.
- Output metrics: For each scenario, calculate LTV, payback months, and LTV:CAC ratio. Visualize impact with tornado charts so the biggest risks jump off the page.
- Review and iterate: Walk finance through the extremes, like a recession‑level churn spike to validate assumptions and refine the model
How to Integrate CAC Payback Period into Strategic Financial Planning
Make your metrics part of the company's operating rhythm.
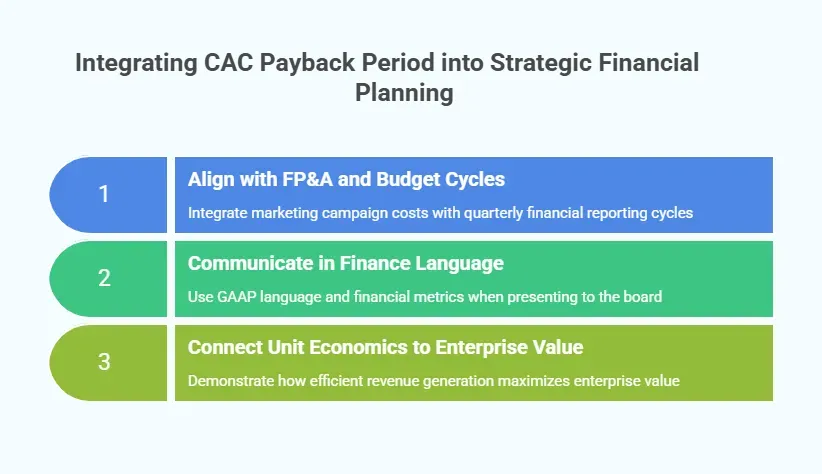
1. Align with FP&A and Budget Cycles
Align your marketing campaign costs with the quarterly financial reporting cycle. When you ask for a budget in Q4, don't just show a slide of potential reach.
Show the CAC payback trends of Q3 and how quickly those dollars turned into recovered revenue. Tie the proposed spend to a clear payback window and spell out whether it lands inside the fiscal year or spills into the next one.
This gives FP&A a concrete way to model cash flow impact and makes marketing spend easier to approve in tighter planning cycles.
2. Communicate in Finance Language
When presenting to the board, make an effort to use GAAP language that finance professionals are familiar with. Also, instead of saying “We grew traffic,” say something like “We improved cost per opportunity by 15% and maintained a net dollar retention of 110%.”
They’re more likely to be receptive as finance teams are concerned about hard data and results. Plus, investors looking for efficient growth (known as the Rule of 40) want to see that you can balance growth with profitability.
3. Connect Unit Economics to Enterprise Value
Investors pay more for a dollar of revenue that is generated efficiently than for a dollar of revenue bought with excessive burn.
A healthy LTV:CAC ratio (3:1) is your strongest lever for maximizing enterprise value during Series B or C rounds, as you can command premium valuations. Predictable unit economics signal low risk and give VCs the confidence to assign premium valuation multiples, often 2x to 3X higher than your high-burn competitors.
Ultimately, showing that you can generate $1 of revenue for $0.30 of spend turns your marketing data into a massive equity asset.
Common Pitfalls Growth-Stage Companies Need to Avoid
Next, we’ll share common mistakes to avoid, especially as a growth-stage company.
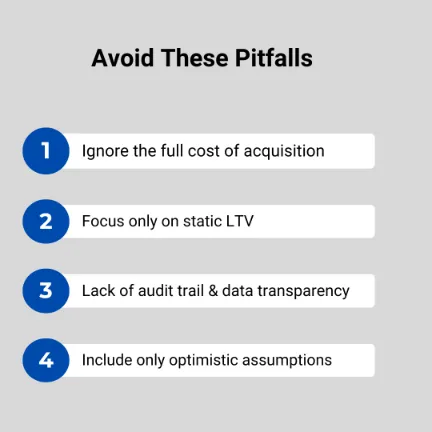
1. Ignoring the Full Cost of Acquisition
Don't hide any costs. If you exclude agency fees, software subscriptions, or the salaries of your sales leader and team, you are artificially lowering CAC.
Eventually, this will show up in the P&L. When it does, your credibility with the finance team will vanish. Either they’ll think you deliberately hid these, or didn’t know you needed to include them.
2. Relying on Static LTV Instead of Cohort-Based Modeling
Static averages don’t give you all the information. Use only these, and you’ll miss out on critical fluctuations like Q4 seasonality or economic downturns. This ends up artificially inflating your projections.
Growth‑stage SaaS companies mostly fall into this trap because static models feel simple and stable. But your Q4 enterprise cohort behaves nothing like your Q2 SMB cohort.
You must switch to dynamic models that adjust automatically as specific cohorts mature (retention curve, expansion pattern, contraction risk, and payback timeline).
This is the only way to capture true retention decay and variability in customer value rather than assuming infinite stability. Finance knows churn isn't flat. And your model shouldn't be either.
3. Failing to Provide Transparent, Auditable Data
Finance teams need to see exactly where the numbers come from: how the CAC payback period is calculated at the cohort level, how churn shapes LTV, and which assumptions are grounded in real data versus wishful thinking.
And beyond the headline metrics, they want the ability to drill down into the underlying data for each cohort and assumption. When there’s no audit trail, skepticism kicks in fast, and your model never makes it into actual planning.
Clear and transparent reporting aligns Marketing, Sales, and Finance on the metrics that matter: NRR, burn multiples, and ACV quality, so no one inflates ROI or sandbags performance in their own silo.
But let’s see what can happen in the opposite scenario, when you focus on optimistic data.
4. Building Models on Optimistic Assumptions
Let’s say your LTV projections get overly rosy and claim a 3:1 LTV:CAC ratio without real cohort data. You end up green‑lighting marketing spend that looks great on paper but falls apart in reality.
Once payback quietly drifts past the 12–18‑month window, your capital is tied up with nothing to show for it. finance sees this pattern a mile away, which is why they shut down models built on optimism with no evidence.
This disconnect leads to overspending in low‑ROI channels and bloated burn rates right when you’re crossing the $10M+ ARR threshold, exactly when discipline matters most.
When assumptions gloss over risks, like lengthening sales cycles or weakening retention, the finance team triggers audits that expose inconsistencies and stall alignment with Marketing and Sales.
Turn Marketing Metrics Into Trustworthy Financial Strategy With 9AM
Optimistic dashboards don’t win over finance. In SaaS, CAC payback period and LTV only matter if the CFO trusts the inputs and the logic behind them.
At 9AM, we help you turn messy acquisition data into numbers finance can actually stand behind. Our team of experts align attribution, costs, and revenue so CAC and payback hold up in real unit‑economics reviews.
And we don’t stop at reporting. We help you build a shared operating rhythm with recurring CAC, LTV, and payback reviews alongside the CFO.
Book a strategy session with us to make your growth metrics finance‑ready.
Frequently Asked Questions
1. What’s a good CAC to LTV ratio?
A strong CAC to LTV ratio is typically 3:1, showing customers generate far more value than they cost. SaaS brands rely on this benchmark to ensure acquisition costs don’t erode margins. Anything lower signals overspending on paid channels; anything higher may mean under‑investing in growth.
2. What is the CAC in financial modeling?
CAC in financial modeling represents the total cost to acquire one customer, including marketing, sales, and onboarding. SaaS teams use it to forecast burn, optimize channel efficiency, and understand how acquisition costs impact runway and long‑term profitability.
3. What does the LTV to CAC ratio indicate in a financial model?
The LTV to CAC ratio shows whether customer revenue outweighs acquisition costs. For SaaS brands, it’s a quick health check: strong ratios signal scalable growth; weak ratios reveal churn, pricing gaps, or inefficient acquisition funnels, all of which can limit scale and weaken financial predictability.
4. What is the 80:20 rule for customer lifetime value?
The 80:20 rule states that 20% of customers drive 80% of revenue. SaaS companies use it to prioritize high‑value segments, refine ICPs, and reduce wasted spend on low‑yield users, especially when optimizing retention and expansion strategies.
5. How long should a CAC payback period be?
A strong CAC payback period is typically under 12 months, helping SaaS brands recover acquisition costs quickly and reinvest faster. Longer payback periods often expose churn, onboarding friction, or pricing misalignment that slows growth and strains cash flow.
6. How does 9AM help B2B companies with LTV/CAC ratio?
9AM builds a full‑funnel strategy to improve LTV/CAC by accelerating revenue recognition and shifting to high‑ROI organic channels. Our expertise helps companies drive annual upfront billing, using usage‑based pricing, improving onboarding to reduce churn, and focusing sales on the highest‑value customer segments.
7. Does 9AM support companies of any size or stage in improving their CAC payback period?
Yes. 9AM works with early‑stage startups, fast‑growing scaleups, and mature companies to shorten CAC payback. Whether you’re building your first motion or optimizing a complex GTM engine, 9AM helps tighten acquisition efficiency and accelerate time‑to‑value.