
The customer acquisition cost (CAC) payback period measures how long it takes a brand to earn back the money spent acquiring a new customer.
At first glance, scaling acquisition seems simple: increase ad spend and bring in more customers. But if the revenue from those customers takes too long to return (or doesn’t provide the right return), “growth” can start draining your working capital.
The faster you recover acquisition costs, the easier it is to reinvest in marketing. Longer payback periods tie up cash and make scaling much harder.
In this article, you’ll learn:
- What CAC payback period measures
- The correct formula for DTC brands
- LTV:CAC ratio vs. CAC payback period: What’s the difference?
- How to build a cohort-based model
- Benchmarks across major DTC categories
- How to reduce your payback time
Struggling to turn paid acquisition into predictable, cash-efficient growth? At 9AM, we build performance marketing systems that bring your CAC payback period down and keep it there. Book a free strategy call now.
TL;DR
- CAC payback period tells you how long your acquisition spend stays locked before customers earn it back. ROAS does not answer this.
- The DTC formula that actually works: nCAC ÷ (Contribution Margin per Order × Monthly Purchase Frequency). Using gross revenue or blended CAC will distort the result.
- A blended payback number hides channel-level problems. Cohort-based modeling, segmented by channel, is what turns payback into a real budget tool.
- Under 6 months is ideal for most DTC categories. Over 12 months creates cash flow pressure that limits how fast you can scale.
What Does CAC Payback Period Actually Measure?
The CAC payback period shows how many months it takes for the profit generated by a customer to cover the cost of acquiring them.
A DTC brand with a 5-month CAC payback period can recover its acquisition spend quickly and recycle that cash into new campaigns.
A brand with an 18-month payback period is essentially fronting the cost of each new customer for a year and a half before seeing a return. That delay creates pressure on cash flow and limits how fast your business can scale.
And here’s a confrontational view point:
In our experience, this metric sometimes matters more than ROAS when you’re thinking about sustainable growth. ROAS tells you the return on a specific campaign, but it doesn’t tell you how long your money is tied up.
Time-Based vs. Unit-Based Recovery
Some operators think about CAC payback in terms of how many orders it takes to recover acquisition cost. That can be useful for understanding customer economics, but it does not show when the cash actually comes back.
For cash flow planning, the more useful view is time-based: how many months it takes for a customer’s cumulative contribution margin to cover their CAC. This shows how long acquisition capital stays tied up before it can be reinvested into new growth.
Why CAC Payback Is Harder to Model in Ecommerce
CAC payback period is often treated as a SaaS metric, but DTC brands cannot copy the SaaS model directly.
In SaaS, revenue usually starts with an initial subscription, then continues through renewals, upgrades, and expansion MRR. That makes payback easier to model because each customer segment tends to follow a clearer recurring revenue pattern.
For enterprise SaaS and other enterprise companies, CAC payback also connects closely to burn rate. If the cost of acquisition is high and the payback window is long, the business needs enough cash to keep funding sales and marketing expenses before those customers become profitable.
DTC brands work differently.
Most customers do not generate fixed monthly revenue, and different customer segments can behave very differently after the first order. One cohort may come back within 30 days, while another may never buy again.
That is why cohort analysis matters so much in ecommerce CAC payback modeling.
You need to see how each acquisition cohort behaves over time instead of assuming a clean subscription-style curve.
This also changes how you evaluate marketing campaigns and customer acquisition strategies. Customers acquired through Meta, Google, influencer campaigns, organic traffic, or email may have different:
- Repurchase behavior
- Contribution margins
- Return rates
- Customer retention patterns
- Customer churn risk
The same logic applies to retention strategies. Improving second-purchase rates, adjusting your pricing strategy, testing selective price increases, or building stronger post-purchase flows can shorten CAC payback without reducing media spend.
In SaaS, teams may use formulas like the TVC formula to understand how variable costs affect profitability. For DTC brands, the same principle applies through contribution margin. The more accurately you account for product costs, fulfillment, shipping, returns, and payment fees, the more reliable your CAC payback model becomes.
LTV:CAC Ratio vs. CAC Payback Period: What’s the Difference?
The LTV:CAC ratio tells you how much value a customer generates over their lifetime relative to what it costs to acquire them. It is a long-term profitability metric tied closely to Customer lifetime value.
Formula: LTV:CAC Ratio = LTV / CAC
The CAC payback period tells you when you recover that acquisition cost through Gross Profit and Monthly profit generated by the customer.
You can have a strong LTV:CAC ratio and still run into cash constraints if payback is too slow. In those cases, revenue looks healthy on paper, but cash flow efficiency breaks down in practice.
Example:
Unit Economics
| Metric | Value |
|---|---|
| Customer Acquisition Cost Average cost to acquire one customer | $80 |
| Customer Lifetime Value Estimated revenue per customer | $320 |
| LTV:CAC Ratio Revenue efficiency indicator | 4:1 |
The economics look strong. But if you need 18 months to recover CAC, the company needs substantial capital to fund acquisition.
This is why we at 9AM treat CAC payback period as a more operational metric when evaluating scaling decisions and overall GTM efficiency.
How to Calculate CAC Payback Period for DTC
The simplest way to think about CAC payback is:
CAC Payback Period = CAC ÷ monthly profit per customer
(Where CAC = ad spend ÷ number of new customers)
This gives you the number of months it takes to recover Customer Acquisition Cost from the profit a customer generates.
In practice, things get more nuanced for DTC brands. Monthly profit per customer is not a fixed number. Several moving parts shape it:
- Average order value
- Gross margin and gross profit per customer
- Purchase frequency and repeat behavior
- Returns and refunds
- Fulfillment and shipping costs
A more DTC-specific way to calculate payback period is:
CAC Payback Period = nCAC ÷ (Contribution Margin per Order × Monthly Purchase Frequency)
Here, nCAC stands for new customer CAC: paid spend divided by new customers from paid channels only. This is different from blended CAC, which includes returning customers and makes payback look shorter than it actually is.
This version reflects how ecommerce actually works. Revenue is not always recurring on a fixed schedule, so the recovery of acquisition costs depends heavily on how often customers come back and how much margin is left after each order.
Example Calculation
Imagine a DTC brand with the following metrics:
- nCAC: $60
- Average order value: $80
- Gross margin: 50 percent
- Monthly purchase frequency: 0.4 orders
First, calculate contribution margin per order:
$80 × 50% = $40 per order
Then monthly profit per customer:
$40 × 0.4 = $16 per month
Now calculate CAC payback period:
$60 ÷ $16 = 3.75 months
In this case, the brand recovers its acquisition costs in just under 4 months.
How Small Changes Impact CAC Payback Period
A small change in any input can move payback by months. That sensitivity is what catches most operators off guard.
To make this concrete, here’s how payback period (in months) shifts across different combinations of contribution margin per order and monthly purchase frequency, assuming a fixed $60 CAC:
Payback Period
| Contribution Margin per order | 0.25 orders/mo | 0.5 orders/mo | 1.0 orders/mo | 1.5 orders/mo |
|---|---|---|---|---|
| $15 | 16.0 mo | 8.0 mo | 4.0 mo | 2.7 mo |
| $25 | 9.6 mo | 4.8 mo | 2.4 mo | 1.6 mo |
| $35 | 6.9 mo | 3.4 mo | 1.7 mo | 1.1 mo |
| $50 | 4.8 mo | 2.4 mo | 1.2 mo | 0.8 mo |
The big takeaway: repurchase frequency does more heavy lifting than most operators expect. A customer who reorders monthly cuts payback time in half compared to one who reorders every other month, even at the same margin.
Where the Standard Advice Breaks Down for DTC
The standard CAC payback formula is straightforward. The trouble is, most DTC operators apply it without adjusting for the parts of their business that quietly distort the result. Here’s where models tend to break down.
Returns are invisible in most models
An order showing $150 in revenue with a 25% return rate has an effective net revenue of $112.50, which moves both your contribution margin and payback timeline. If you’re calculating against gross order values, your model and your cash position will not match.
Blended CAC creates false confidence
A brand with strong repeat purchaser volume will show a low blended CAC even as new customer acquisition costs climb. Payback is a new customer metric. Always use new customer CAC.
Cohort curves go stale fast
A cohort that looks healthy at month 3 can deteriorate sharply by month 6 if retention drops. Calculating payback quarterly means you are working from delayed signals. Monthly cohort updates are the minimum if you are actively scaling paid acquisition.
Seasonality distorts the model in both directions
Q4 cohorts, especially those acquired during peak periods like Black Friday/Cyber Monday, often carry inflated CAC and skewed first-order AOV from promotional pricing. Running them through the same model as a July cohort produces averages that aren’t accurate for either group.
Multi-touch attribution gaps distort nCAC
If paid channels get credit for orders that organic, email, or returning demand would have driven anyway, paid CAC can look artificially low. If paid channels are under-credited, nCAC can look artificially high. Either way, the payback model becomes unreliable.
Running an attribution model audit can help identify where these gaps exist and reveal if your reporting is inflating acquisition costs.
Cohort-Based Modeling: The Framework That Works for DTC
Customers acquired through different channels don’t behave the same way, so treating them as one population means you are optimizing for an average that doesn’t reflect any real customer group.
From our experience, cohort-based modeling fixes that by giving you a real view of how each group of customers performs over time.
It also surfaces patterns that blended metrics hide. You can see healthy overall revenue growth while newer cohorts aren’t sticking around as long. In that situation, your CAC payback period is quietly stretching even as top-line revenue keeps climbing.
How to Structure a CAC Payback Cohort Model
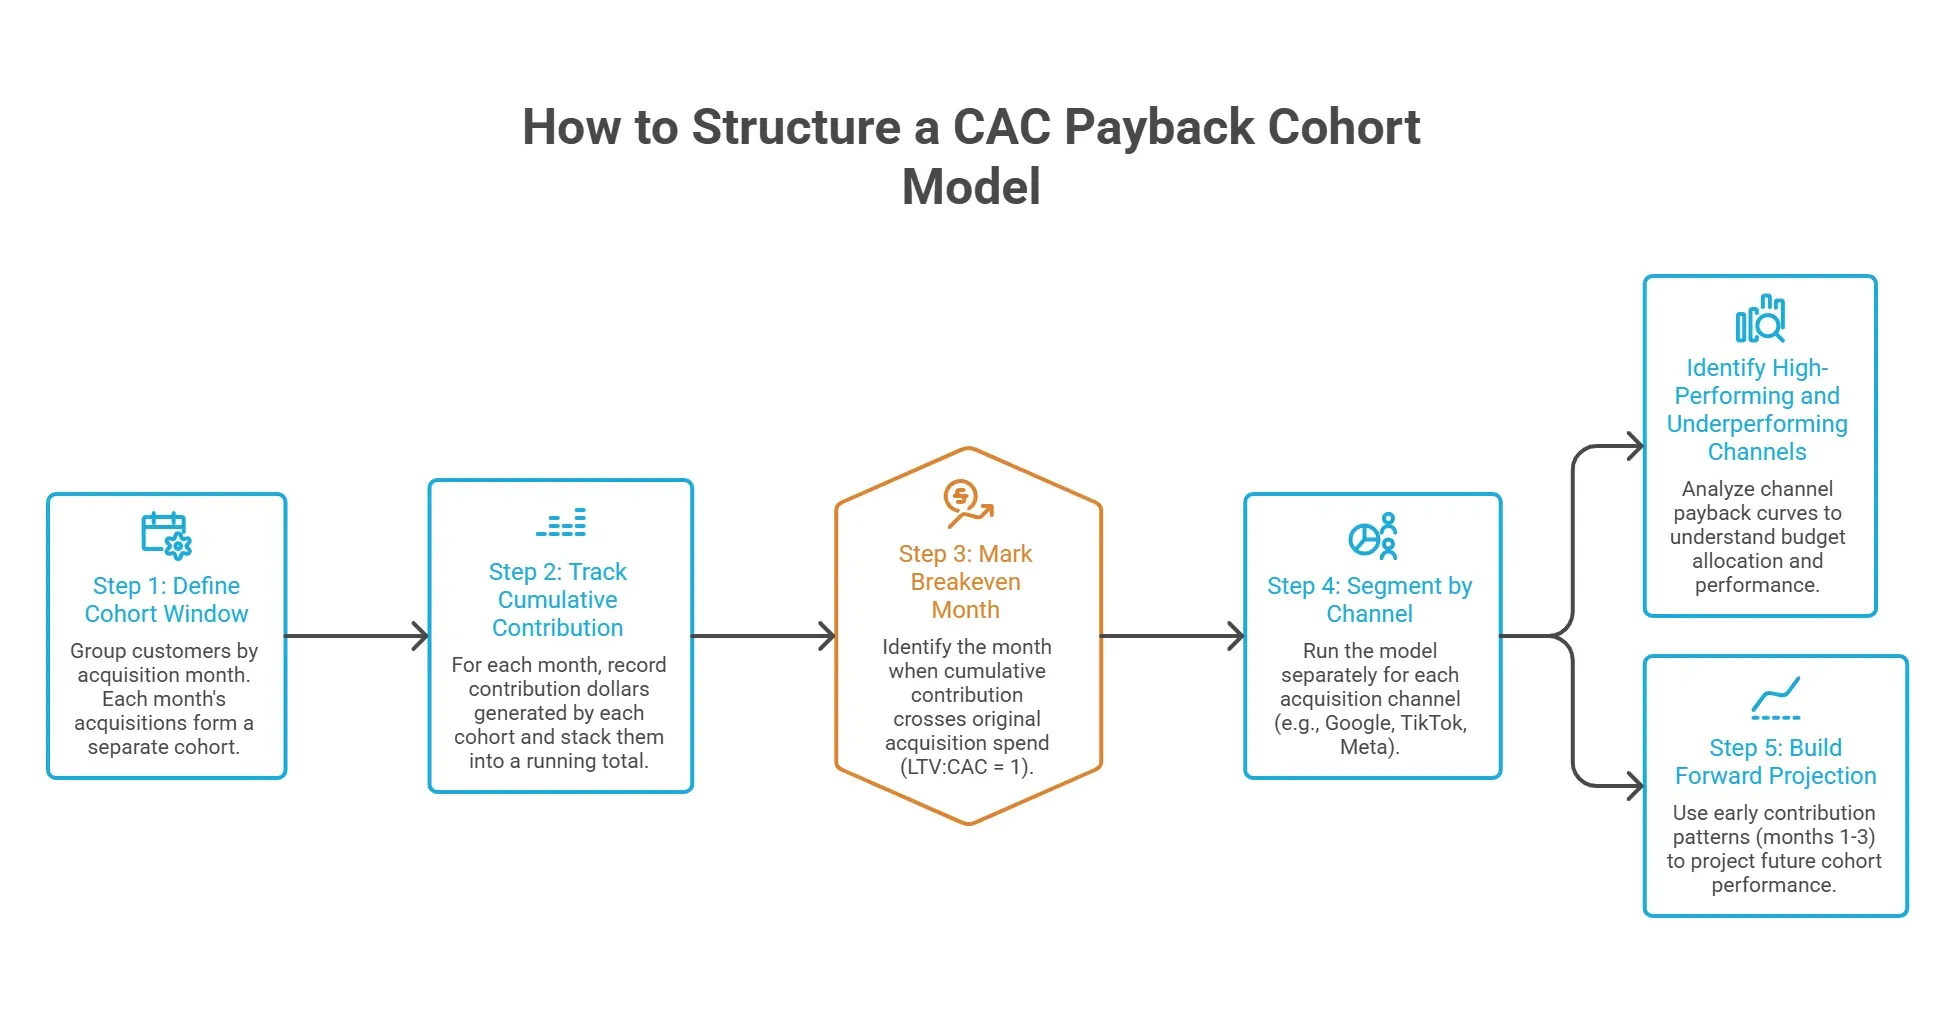
Step 1: Define your cohort window
Group customers by acquisition month. Every customer acquired in January is one cohort, February is another. Each cohort is a separate population you track from M0 forward.
Step 2: Track cumulative contribution per cohort
For each subsequent month, record the contribution dollars generated by that cohort. Stack them month-over-month into a running total.
Step 3: Mark the breakeven month.
Your payback period is the month when cumulative contribution crosses the original acquisition spend for that cohort. This is also the month when LTV:CAC = 1.
Step 4: Segment by channel.
Run the model separately for Google, TikTok, and Meta ads. Each channel comes with its own margin profile and customer behavior, which means each one has its own payback curve.
Looking at them this way turns CAC payback into a real budget tool. You get to see which channels are pulling their weight and which ones are dragging the blended number down.
Step 5: Build a forward projection
Use months 1–3 contribution patterns to project where each cohort will land. That way, you spot a broken cohort early instead of discovering it 12 months in.
The Unrecovered CAC Number
Unrecovered CAC is the portion of your acquisition spend that hasn’t been earned back yet by the customers you spent it on. Every cohort still working through its payback period contributes to this pool, and at any given time, a scaling brand is carrying the sum of it across all active cohorts. This is your working capital trap.
Say you spend $100K per month on acquisition with an 8-month payback period. At steady state, you have $800K of cash tied up in customer acquisition before any new dollar starts working for you.
That number grows directly with acquisition volume, which is why brands that scale ad spend aggressively without tracking unrecovered CAC often run into cash crunches even when their unit economics look healthy on paper.
What Is a “Good” CAC Payback Period in DTC?
A CAC payback period under 12 months is generally considered healthy for DTC, with under 6 months viewed as ideal. However, what’s healthy for you depends on your category, margins, and how often your customers come back.
Here’s a rough breakdown of where most DTC brands should aim by category:
DTC CAC Payback Period
| DTC Category | Benchmark CAC Payback Period |
|---|---|
| Beauty and skincare | 3 to 6 months. High repeat rates and decent margins make this range achievable, especially for brands with strong post-purchase flows. |
| Apparel and fashion | 6 to 9 months. Higher return rates and seasonal buying behavior pull payback longer. |
| Supplements | 2 to 4 months. Subscription and replenishment behavior makes this one of the fastest-recovering categories in DTC. |
| Home goods | 9 to 12 months. Lower purchase frequency means more weight has to come from first-order margin and AOV. |
| Subscription boxes | Under 90 days. Anything past that usually points to a retention or first-order economics issue. |
A “good” CAC payback period depends on your funding stage, too:
CAC Payback by Business Stage
| Business Stage | Benchmark CAC Payback Period |
|---|---|
| Bootstrapped brands | Under 60 days. Often need a sub-60-day payback to keep cash flow positive without outside capital. |
| Funded brands | 6 to 18 months. Can reasonably operate in this range depending on category and LTV. |
| Mature brands | Below 12 months. Expected range since cash recovery directly affects how aggressively they can reinvest. |
Use these benchmarks as a sanity check. The real test is how much cash your payback period frees up for the next round of acquisition. When that pool runs thin, growth quietly turns into a working capital problem.
How to Reduce Your CAC Payback Period Without Slashing Ad Spend
Pulling back on acquisition is the obvious lever, but it is rarely the right one. Cutting spend slows growth before it fixes the underlying problem. There are four other levers that move payback faster.
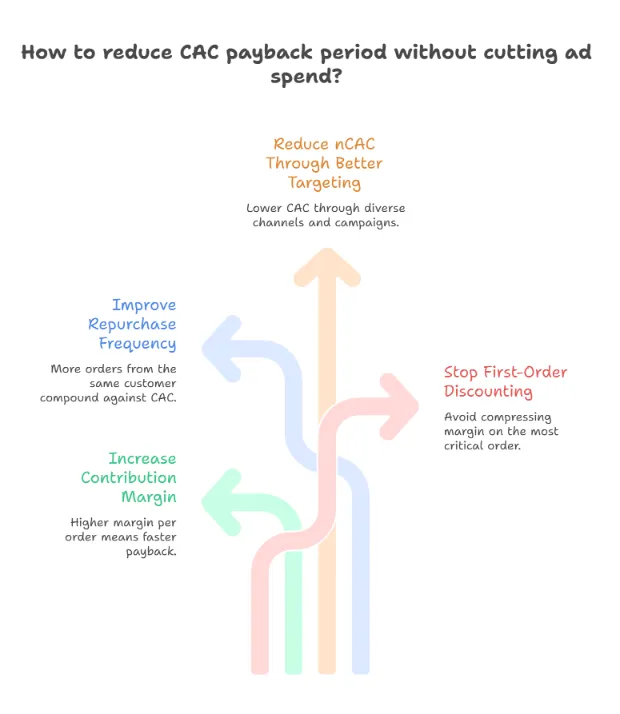
1. Increase Contribution Margin per Order
Higher margin per order means each customer pays back faster, no matter how often they buy. The practical levers here are bundling to lift AOV, negotiating better COGS as you scale, and shifting your channel mix toward higher-margin DTC orders over marketplace channels where fees eat into margin.
2. Improve Repurchase Frequency
Every additional order from the same customer compounds against your original acquisition cost. The most effective tactics here:
- Subscribe-and-save programs to convert probabilistic repeat purchase into guaranteed monthly contribution.
- Email and SMS flows timed to actual repurchase windows (not arbitrary calendar schedules) bring customers back at the right moment.
- Loyalty programs work best when they reward the second and third purchase specifically, since that is where most DTC churn happens.B&S Co’s analysis of 156,000+ DTC customers found that only 18.8% make a second purchase within a year, meaning 81% of customers buy once and never return
3. Reduce nCAC Through Better Targeting
Bringing nCAC down is harder than it used to be, but the levers that still work consistently are:
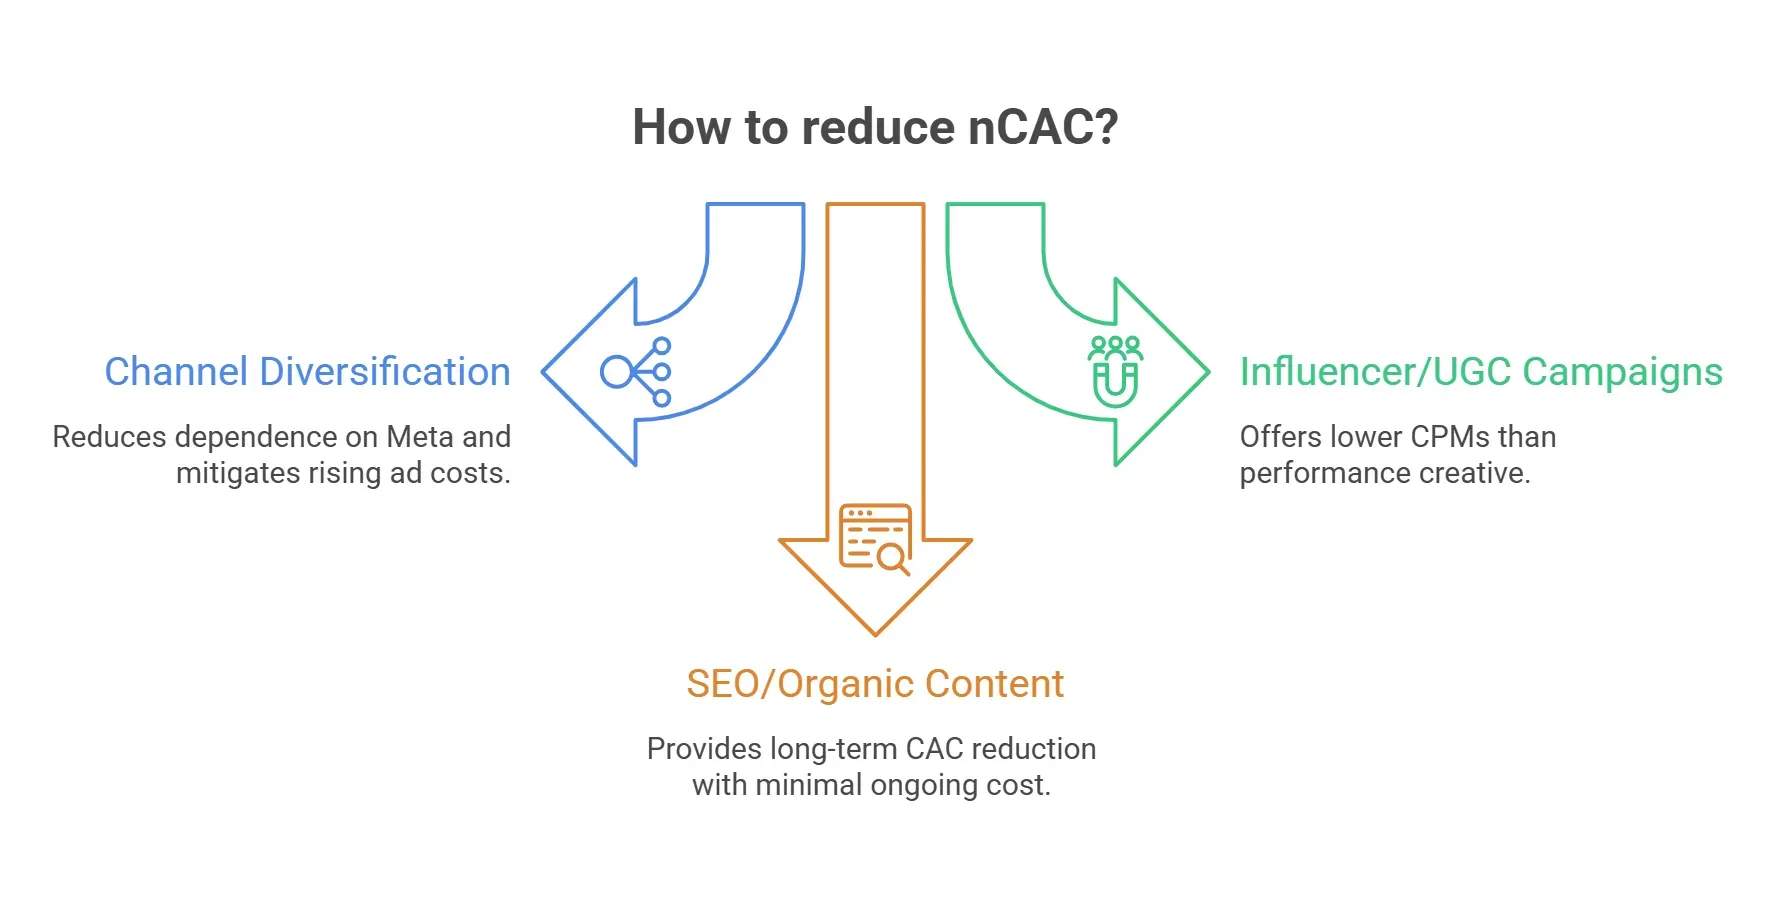
- Channel diversification reduces dependence on Meta, where rising ad costs have steadily pushed DTC nCAC higher over the last few years. Triple Whale’s 2025 benchmarks show Meta CPMs rose 20% year-over-year on average, with every industry hit by increases between 8% and 38%.
- Influencer and UGC campaigns often produce lower CPMs than performance creative aimed at cold audiences. UGC-based ads achieve 4x higher click-through rates than average, which brings down effective CPMs.
This approach has worked for our clients. For example, we helped GenomeLink drive a 77% reduction in CAC over three years by building a creative system that produced 70+ unique assets per month across six different creative types.
The diversity of creative kept acquisition costs low even as the brand scaled, which directly shortened their payback period without cutting media spend.
4. Stop Discounting on the First Order
This is the most common self-inflicted payback problem in DTC. Offering 20% off on the first purchase compresses your contribution margin on the exact order that needs to do the most work to recover CAC.
If you must discount to convert, model the payback impact before committing to it. Most brands do not realize they are extending their own payback timeline by design.
Turn CAC Payback Into a Cash Flow Advantage with 9AM
CAC payback period is one of the clearest signals of whether your DTC growth is sustainable or quietly eating into your runway. The real value comes from modeling it at the cohort level, segmenting by channel, and tracking it consistently as you scale.
Get this right, and you avoid the most common DTC trap: scaling spend faster than your cash can come back to fund the next round of acquisition.
At 9AM, we help DTC brands build payback models that hold up under finance scrutiny and translate them into faster, more confident scaling decisions.
Book a strategy call now to find where cash recovery can be accelerated.
FAQs
What is the CAC payback period for DTC brands?
The CAC payback period is the number of months it takes for a customer’s cumulative contribution margin to equal the cost of acquiring them. For DTC, this depends on contribution margin per order and repurchase frequency, not just first-order revenue.
What’s a good CAC payback period for ecommerce brands?
Under 6 months is considered strong for most DTC categories. Above 12 months creates cash flow pressure and typically requires outside capital to sustain. The right benchmark depends on your category, margins, and repurchase cycle.
How do you calculate CAC payback with subscriptions?
For subscription-based DTC brands, divide your nCAC by the monthly contribution margin per subscriber. Since subscription revenue is more predictable than transactional repeat purchase, the formula simplifies to nCAC ÷ monthly contribution profit, similar to the SaaS approach.
Should I use blended CAC or new customer CAC for payback?
Always use new customer CAC (nCAC). Blended CAC includes returning customers who cost near-zero to re-engage, which makes payback look shorter than it actually is for new acquisitions.
Appendix
- CAC Payback Basics: What It Is, How to Calculate It and Why It Matters
- CAC Payback Period Explained: Formula + Strategies to Reduce It | Saras Analytics
- What is Lifetime Value (LTV)? (And Why It’s the Most Important Success Metric for Ecommerce)
- Repeat Purchase Rate Benchmarks: 18.8% Across 156K Customers | BS&Co
- Facebook Ad Benchmarks by Industry (Updated Data) | Triple Whale
- DTC CAC Payback Period: What It Is and How to Optimize It | MHI Growth Engine
- CAC Payback Period for E-commerce: How to Scale Profitably