
The need for executive-level measurements that link ads to business growth has increased over the years.
Finance managers need something more than just ROAS to convince them that their marketing investment was worth it.
That’s why in this guide, we give you actionable advice on how to calculate and use MER to notice problems that other metrics may be blind to.
You’ll see the benchmark MER for your kind of company and get an action plan you can implement based on your target MER.
And once you’re ready to communicate marketing gains to management, our downloadable sample reporting template shows you exactly how to give recommendations at the next meeting.
Let’s dive in.
TL;DR
- MER = Total revenue divided by Total marketing spend
- Good MER is typically between 3.0 and 5.0
- ROAS is a platform-specific metric for measuring revenue from a marketing campaign or a platform/channel
- ROAS fails because multiple channels claim the same sale/conversion
- MER works best for business-level decision making and overall business health, while ROAS is great at campaign-specific measurement
- Applying both appropriately gives you the big picture on how to fully make ad dollars work for you.
The Attribution Dilemma: Why Upper Management Doesn’t Trust Platform ROAS
At the upper-level of management, your CFO primarily cares about one thing: revenue growth.
So when you’re at a strategy meeting, going on and on about the 17% reduction in customer acquisition costs, the first question any manager asks is:
“Okay, so we should be in the green. Why aren’t we?”
And those 11 words stop you smack in the middle of your 42-slide PowerPoint presentation.
That’s where ROAS starts to lose credibility.
CAC usually enters the same conversation as ROAS because both are used to prove paid media efficiency. But when platform ROAS looks strong and CAC looks lower while total revenue still feels flat, management starts questioning the measurement model itself.
Here’s the problem with basic ROAS: it gives you tunnel vision.
You start thinking that one channel performing well means marketing is working overall. But in this post-iOS 14 and cookie-restricted world, the last click takes all. Any platform responsible for the final interaction can claim the full conversion, even when earlier touchpoints helped create the demand.
The harder it gets to track third-party data, the more over-attribution becomes a recurring problem. That doesn’t make all your data useless, but it does make platform-reported ROAS harder to trust for budget planning.

Fighting Attribution-Blindness With Marketing Efficiency Ratio
Metrics like CAC, CPC, and CTR often support the ROAS story. A campaign may show a lower CPC, stronger CTR, better CAC, and higher platform ROAS, but that still doesn’t prove it created incremental revenue.
That’s the attribution blindness problem.
ROAS can mislead for two main reasons.
- First, it often excludes parts of brand spend, creative production, influencer activity, and other costs that helped create the sale. That can make performance look more efficient than it really is.
- Second, platform ROAS is channel-specific. It tells you what happened inside one platform, but it does not show how that platform interacted with the rest of your marketing ecosystem. So platform ROAS creates a walled-garden problem, where each channel can overstate its own role in the sale.
This is also why non-marketing managers struggle with campaign-level metrics. CTR, CPC, CAC, and ROAS may all show useful signals, but they don’t automatically explain whether marketing is improving total business performance.
Marketers may see the connection instantly. Your CFO sees the bottom line.
This is where MER cuts through the attribution noise.
MER does not try to assign perfect credit to every touchpoint. Instead, it steps above the attribution fight by comparing total revenue to total marketing spend. So if an email newsletter plants the idea, paid social reinforces demand, and the final conversion happens through search or direct traffic, MER still captures the overall efficiency of the system.
That makes it easier to answer the question leadership actually cares about:
“For every dollar we spend on marketing, how much revenue are we generating?”
Stronger attribution can help reduce wasted ad spend, but MER solves a different problem. It gives managers a cleaner business-level view when platform attribution becomes too noisy, fragmented, or overinflated.
What Is MER?
Marketing Efficiency Ratio, also known as Media Efficiency Ratio (MER), is a measure of the relationship that exists between the total revenue your company makes and everything you spend on advertising, within a timeframe.
Unlike your ROAS, which is a campaign-level metric, MER steps back to look at performance from a holistic angle.
All campaigns and channels are viewed at once to show how effectively all your marketing investments are turning into business revenue.
How to calculate MER?
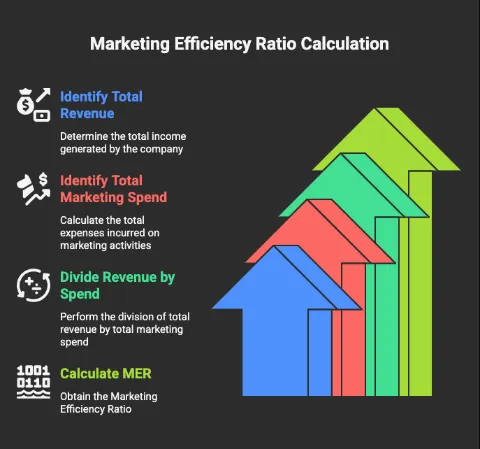
Marketing Efficiency Ratio is a simple calculation using this formula: your total revenue divided by total marketing spend/expense.
So, for example, if you spent $1 million on marketing and made $4 million, your MER would be 4.0. Meaning that for every ad dollar spent, you get back four dollars for your business.
From the formula, you can already see there is no channel isolation or single ad campaign focus. What you get is the cumulative effect of all your marketing activity working together.
This activity goes beyond BOFU conversion attribution to include top-of-funnel channels like TikTok and blog posts. This matters because TikTok is 1.9x more likely to be responsible for the first click than the last click, so the platform is great at tuning an audience in on your brand.
MER even accounts for the word-of-mouth or brand impact that you can’t measure. This is why it’s often referred to as blended ROAS.
You can also use advanced variations of MER, like;
- aMER (acquisition MER) for new customers = New Customer Total Revenue / Marketing Spend.
- Marginal/contribution margin = (Total Revenue - COGS) / Total Ad Spend (The COGS is the cost of producing/delivering the items sold.)
You can use these to explain more nuanced problems, but we advise you to start with basic MER first.
MER vs TACoS
Some industries frame MER up as Total Advertising Cost of Sale (TACoS), because they’re conceptually similar.
They both try to understand the impact of all marketing efforts and what you spend on all of your revenue.
But where MER shows the revenue for every dollar spent, TACoS shows the ad spend for every dollar earned.
Another fundamental difference is in their industry application.
The Marketing Efficiency Ratio can be used just about anywhere. Whereas with TACoS, you’ll have to be an Amazon/eComm marketer to hear this term used as often.
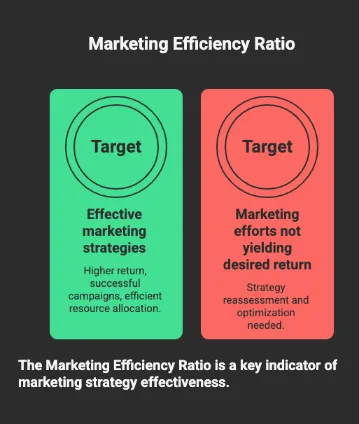
Benefits of Following MER
MER helps you cut through platform-by-platform noise and meet your central business objectives.
It isn’t supposed to guide media-buying decisions at the campaign level, but on the broader stage, it’s a northstar metric that makes sense of how your marketing costs are a multiplier of revenue generation.
Other benefits include:
- It is an optimal budget reallocation indicator
- It provides a holistic business view
- It helps with strategic decision-making
- It is a great performance tracker
- It tells you when you might be underinvested and need to increase marketing spend.
We’ll get to see each of these benefits manifest in different ways throughout this article.
What Is a Good MER? MER Benchmarks per Industry
Good MER usually stays within the 3.0 and 5.0 mark, but that’s a general assumption. The truth is, there is no universally accepted answer to “What is a good Marketing Efficiency Ratio?”
What’s good for your business depends entirely on the industry you operate in, your business lifecycle, and your growth goals.
Across 9AM clients, median MER typically ranges between 4.2x and 4.8x, which shows strong revenue efficiency across managed accounts. This means marketing is driving attributed platform results and supporting healthy total revenue relative to spend. Still, MER targets should always be evaluated by business model, margin, growth stage, and revenue goals.
Here’s how practical MER ranges usually differ by industry:
When You Need MER vs When to Use ROAS
Use MER when looking at the bigger picture at the macro level, and use ROAS when looking channel-by-channel at the campaign level (micro level).
Yes, it’s that simple.
MER sidesteps attribution issues in a world with ever-increasing privacy issues. It shines in omnichannel campaigns where there might be multiple touch points before the sale.
That “expected” conversion from your paid campaign may have started earlier, when a blog post, creator mention, email, or social touchpoint created demand. Campaign ROAS may still credit the sale to the final ad interaction, but it won’t show the full path that made the conversion possible.
But ROAS has its place, too.
Since ROAS campaign revenue is divided by campaign spend, it tells you which platforms, ads, or audiences are converting best under your attribution model.
And it shows what channels you need to optimize or reallocate budget to or from for maximum impact.
To summarize this comparison:
Use Marketing Efficiency Ratio when:
- Proving the effectiveness of marketing for budget approval.
- Evaluating overall business health and profitability (if you include COGS, shipping, discounts, salaries, tooling, and agency fees in your marketing spend from the start).
- Measuring the combined impact of paid and organic marketing, on top of brand awareness activities.
Use Return On Ad Spend when:
- Optimizing for a single channel or campaign.
- Allocating and reallocating budget (tactical decisions).
- Testing strategies like bidding, creative, and targeting.
MER vs Other Metrics
Let's compare MER with other metrics to see where it’s ideal to use each one:
- ROI vs MER:
- ROI = Net profit / Investment cost
- MER = Total revenue / Total marketing spend
ROI measures profitability. MER measures revenue efficiency.
That difference matters. ROI requires a clear view of profit, which means you need to account for product costs, fulfillment, salaries, agency fees, software, overhead, and other expenses. MER is simpler because it asks a narrower question: how much revenue did the business generate for every dollar spent on marketing?
MER is easier to use as a high-level marketing signal, but it should not replace profitability analysis. A business can have a strong MER and still struggle with margins if product costs, discounts, returns, or operating costs are too high.
- CAC vs MER:
- CAC = Sales and marketing costs / New customers acquired
- MER = Total revenue / Total marketing spend
CAC tells you how much it costs to acquire a new customer, so it’s useful when you want to understand acquisition efficiency. MER tells you how efficiently total marketing spend turns into total revenue, so it’s useful when you want to understand whether the whole marketing engine is producing enough revenue.
If CAC looks strong but MER is weak, the issue could be low order value, weak repeat purchase behavior, poor retention, heavy discounting, delayed revenue, or too much spend going into channels that do not convert quickly.
If MER is strong but CAC is weak, marketing may still be producing revenue overall, but new customer acquisition could be getting expensive. In that case, you should be careful about scaling spend until you know whether repeat purchases, LTV, retention, or existing customer revenue are carrying the numbers.
MER Action Plan: Combining MER + ROAS
The Marketing Efficiency Ratio isn’t meant to replace ROAS or any other campaign-specific metric. In fact, its true strength shines when you pair it with ROAS.
MER is great at spotting a problem or opportunity, and on the granular level, ROAS tells you where to focus your marketing efforts based on the MER’s observation.
When MER Is Below Your Target
This usually means total revenue is not keeping up with total marketing spend, so you need to diagnose the cause across pricing, conversion, offer, channel mix, margins, and measurement windows.
But before concluding, you should first check that your measurement window is right.
Daily MER is usually too noisy for strategic decisions. Monthly MER can show direction, but quarterly MER gives a cleaner read, especially if your sales cycle is long, your campaigns have delayed impact, or seasonality affects demand.
Next, use ROAS to check if your channel mix is wrong or underperforming, then diagnose the problem (hint: you might be spending on channels that don’t make a difference).
When MER Is Above the Target
On the reverse, a high MER ratio is great, but it is no cause to celebrate just yet. More often than not, you might be underinvesting in marketing*. Whether you’re an eCommerce business, a B2B, or a growing SaaS brand, you could be growing a lot faster instead of sitting on your laurels.
* Side note: It can also mean strong organic demand, strong retention, efficient lifecycle revenue, seasonal demand, or temporary demand capture.
To make sure you’re sufficiently geared, try to scale paid media spend by, say, 10-15%
If MER remains level, you likely have room to scale. But check contribution margin, new vs returning customer mix, CAC, payback period, and operational capacity before continuing to raise spend.
So you can keep raising spending until MER starts to decline. At that point, you can ease your foot off the gas, but only a little bit.
There are exceptions, of course. If your current MER satisfies your growth and internal goals, you can keep doing what you’re doing.
It's not always about maximizing revenue to the nth degree.
Bottom line: MER gives executives a simple answer to a business-level question: is total marketing spend producing enough revenue to justify the investment?
Common MER Mistakes
Here are some of the patterns we’ve found come up again and again when marketers and businesses are new at trying out MER:
- Cherry picking your best MER sales cycles and windows. This kills credibility and shouldn’t be your go-to. Instead, we advise you to show consistent measurement windows and even include important context like seasonality.
- Excluding any spend, especially brand spend, since it may be hard to attribute. You make MER artificially high when you do this, and that might mislead the whole organization.
- Comparing across different industries and growth stages. A disruptive FinTech and a mature eCommerce storefront have entirely different average MERs. It’s best to compare against your own industry benchmarks and your company’s MER history.
- Using MER for channel-specific decisions. Instead of doing that, use MER as a general diagnostic, and then flex your improved ROAS and other special metrics accordingly.
- Panicking over short-term dips in the MER. MER is better over longer periods (quarterly and biannually), so it may take some time to show up. Be calm and don’t let management see you sweat.
Finance Team Reporting Template

Here’s a one-slide dashboard that won’t overwhelm your CFO, while still incorporating platform-ROAS:
Target MER: 3.5 - 5.0
Current MER: 4.6
Trending: Upward 15%, Quarter-on-Quarter.
Contribution per Channel:
- Social Media (Paid): 22% of revenue ← 25% of spend
- Social Media (Organic): 30% of revenue ← 20% of spend
- Paid Search: 13% of revenue ← 15% of spend
- Organic Search: 20 of revenue ← 15% of spend
- Email: 10% of revenue ← 15% of spend
- Direct/Referral/Brand/Other: 5% of revenue ← 10% of spend
Recommendations: Increase ad spend by 10% in the next quarter.
Reason: MER has been strong within the target over the past 9 months.
That’s all there is to it. You can go deeper during the weekly marketing stand-up meeting with your team. But everything finance managers are concerned about is:
- Current MER against Target MER
- Trend direction as well as velocity
- Clear recommendations with defensible reasoning
- Measurement confidence levels
Correct Your ROAS & MER With 9AM
You now know what MER is, how it works, and even have a neat template for anytime you have to consolidate all the various metrics into a simple report.
Now it’s time to implement that improved action plan at the corporate level, and there’s no agency better suited to meet your measurement needs than 9AM.
Get on a strategy call with us today to get a front row seat to your personalized MER analysis and a progress roadmap.
FAQ
If we have a super low MER but are growing just fine, should we be worried?
You shouldn’t be bothered. If you’re growing just fine, then you probably have a unique growth target different from what your average business (e.g., hypergrowth). Just to be sure, audit your performance to check if you’re blowing money on ineffective marketing.
How quickly can MER improve?
Sustainable change is noticeable within 3 to 6 months. If an agency promises a one-month change, then we hate to break it to you, it’s a dud. Marketing has a compounding effect where it builds up slowly and then quickly starts to multiply.
What is the relationship between MER and ROAS?
MER is calculated as the ratio of total earnings from all marketing efforts. It contains all ROAS measurements (channel-tied revenue divided by channel-tied spend) within it.
Can MER include marketing team salaries?
It’s best practice that you do this. Since MER is an efficiency ratio, adding all expenses, including non-direct expenses like salaries, lets you measure true efficiency. But if your goal is understanding how effective a marketing campaign was, then you don’t need to add salaries in your MER formula.
If 3:1 ROAS is good, isn’t that the same as 3.0 MER?
No, because ROAS is idealistic, and MER is attribution-agnostic. For instance, platform ROAS doesn’t account for brand spend and even duplicates attribution to look better. When you take into account all these excluded expenses, that 3:1 ROAS can be a 2.0 MER, or even lower.
Appendix
- Transcend: https://transcend.io/blog/2025-cookie-consent-laws
- Neil Patel: https://neilpatel.com/marketing-stats/customer-journey-touchpoints/
- MarketingLTB: https://marketingltb.com/blog/statistics/marketing-attribution-statistics/
- Investopedia: https://www.investopedia.com/terms/f/fastmoving-consumer-goods-fmcg.asp
- Admetrics: https://www.admetrics.io/en/post/marketing-efficiency-ratio-dtc-ecommerce-22858
- Alexander Jarvis: https://www.alexanderjarvis.com/what-is-marketing-efficiency-in-saas