
You can track campaign performance from every angle today. Customer acquisition cost, return on ad spend, conversion rates, and channel-level metrics all look precise inside your dashboards. Yet many of you still struggle to connect those numbers to real sales revenue and gross margin.
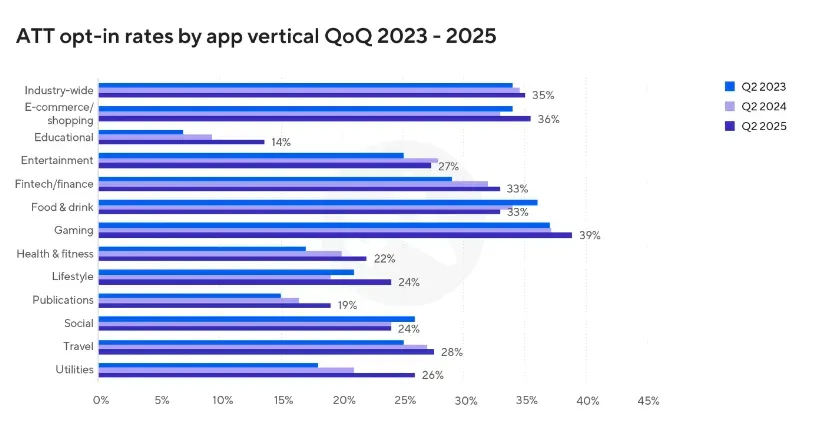
With only 35% of users opting into tracking in 2025, digital advertising data has become less reliable. Cost Per Result (CPR) can look efficient inside an ad campaign, even when your bank account tells a different story.
That’s where Marketing Efficiency Ratio (MER) changes the conversation.
Instead of focusing on isolated ad campaign results, it measures how your total paid media investment impacts total revenue across your marketing ecosystem.
In this blog, you’ll learn when CPR makes sense, where it falls short, and how Marketing Efficiency Ratio can guide smarter Marketing Strategies.
P.S.: Are your dashboards telling one story while your profit and loss statement tells another? 9AM can help you align campaign performance with financial reality using Marketing Efficiency Ratio as the strategic anchor.
TL;DR
- ROAS is a platform-tied metric while the MER is a holistic business metric.
- A healthy MER recognizes non-working costs like agency and tools.
- Switching to MER protects your business from attribution blindness and reliance on cookies or last-click data.
- MER can only help if you evaluate it against your contribution margin (sales less variable costs), which bridges marketing to finance decision-making.
Why Your Dashboards Don’t Reflect Real Business Performance
Your dashboards show campaign performance across every ad channel. You see return on ad spend, customer acquisition cost, conversion rates, and Cost Per Result updating in real time.
On paper, everything looks efficient.
The issue is that these metrics operate at the channel level. Each platform reports what it can attribute, based on limited tracking and modeled data. With fragmented digital advertising environments and declining opt-in rates, those numbers rarely capture the full marketing ecosystem.
In our experience working with growth teams, this is where most companies misread performance. Customer acquisition can look efficient inside paid media reports, yet total sales revenue and gross margin tell a different story.
This happens because channel-level metrics optimize isolated ad campaigns rather than overall business performance.
When you focus only on return on ad spend or Cost Per Result, you improve parts of the system. You do not measure how all your marketing campaigns work together to drive real incremental contribution.
That disconnect is exactly where the Marketing Efficiency Ratio becomes necessary.
What is the Marketing Efficiency Ratio (MER)?
The Marketing Efficiency Ratio measures how much total revenue your business generates relative to total marketing spend. It reflects how your entire marketing ecosystem performs, not just what individual ad channels report.
Unlike Return on Ad Spend (ROAS) or Cost Per Result, MER does not rely on attributed conversions from a single platform. It accounts for the combined impact of paid media, creative, agency fees, tools, and supporting channels that influence customer acquisition and customer retention.
In our experience, this is where most teams shift from platform optimization to business-level thinking. MER connects campaign performance directly to financial outcomes, which makes it easier to align marketing decisions with contribution margin and long-term profitability.
Now that we’ve seen what MER is, it’s time to learn its formula.
How to Calculate The Marketing Efficiency Ratio Formula
The formula is straightforward. To calculate MER correctly, bring the total revenue you get from marketing over any specific timeframe and divide it by your total marketing spend in that same time period.
For example, let’s say your company generated $750,000 in total revenue last quarter and spent $150,000 on marketing.
MER = 750,000 ÷ 150,000 = 5.0
This means that for every $1 invested in marketing, your business generated $5 in total revenue.
However, the interpretation depends on how you define marketing spend.
Media Efficiency Ratio only considers what you spend on paid media as your total marketing spend.
Meanwhile, Total MER considers everything responsible for bringing marketing assets out. This includes ad creation, agency fees, marketing automation tools, and analytics infrastructure.
We recommend using total MER. Excluding non-working costs usually inflates performance and creates misalignment between dashboards and Profit and Loss statements.
What is a Healthy Marketing Efficiency Ratio (MER)?
A healthy Marketing Efficiency Ratio is typically 3.0 or higher. This means you generate at least $3 in revenue for every $1 spent on marketing. However, the right target depends on your margins, cost structure, and growth stage.
For e-commerce brands, the required MER is often higher. Because physical products carry inventory, shipping, and fulfillment costs, many ecommerce businesses aim for 4 to 5 or more to protect contribution margin and maintain sustainable sales revenue.
SaaS companies, on the other hand, operate differently. Since Customer Lifetime Value builds over time, an MER around 3 can still support profitable growth, particularly when retention rates are strong, and churn is controlled.
Benchmarks also vary by company size.
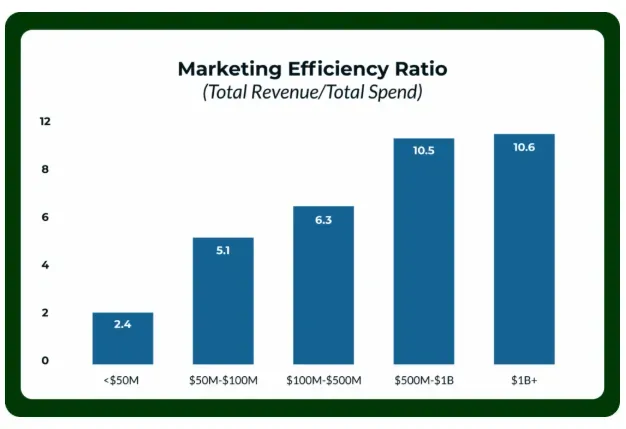
According to Keen’s Marketing Insights Report, brands generating over $500 million in revenue reported marketing efficiency ratios above 10.
Smaller companies typically fell between 2.4 and 5.1. This spread highlights how scale, margin structure, and brand maturity influence what “healthy” looks like.
Early-stage businesses are another case entirely. During the initial demand-building phase, MER may sit below efficient benchmarks. From what we have observed, efficiency becomes meaningful once revenue stabilizes and repeat purchases begin contributing to long-term value.
Ultimately, the only reliable way to define a healthy MER is to reverse-engineer it from your profit targets and allowable marketing spend. That approach aligns campaign performance with financial reality instead of relying on industry averages.
Marketing Efficiency Ratio (MER) vs ROAS vs CPR
Return on ad spend, Cost Per Result, and Marketing Efficiency Ratio all measure efficiency. The difference lies in what they measure and how far their visibility extends across your marketing ecosystem.
Return on Ad Spend: Platform-Level Efficiency
Return on ad spend measures revenue attributed to a specific ad channel divided by the spend on that channel. It tells you how efficiently a platform converts demand into sales.
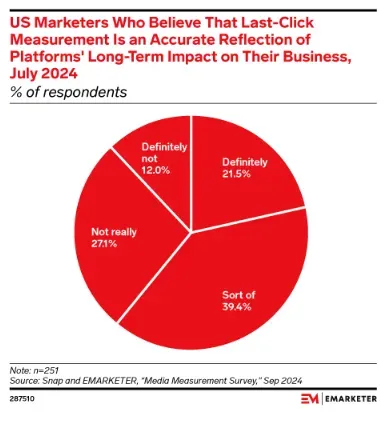
The limitation is attribution. eMarketer Research shows that nearly 74.5% of marketers still rely on last-click attribution, yet only a small fraction (21.5%) believe it accurately reflects long-term business impact.
ROAS depends on platform reporting and modeled conversions, which rely on partial tracking data. As privacy restrictions increased, attribution became less precise.
This means ROAS reflects what a platform can claim, not necessarily the full incremental contribution of that channel.
In our experience working with growth teams, this is typically where scaling decisions go wrong. Strong platform ROAS can mask flat revenue growth at the business level.
ROAS is valuable for optimizing campaign performance within paid media. However, it does not account for non-working costs, cross-channel influence, or contribution margin.
Cost Per Result (CPR): Event-Level Efficiency
Cost Per Result measures how much you pay to generate a specific action, such as a purchase, lead, or add-to-cart event.
This metric is useful for monitoring conversion campaigns and managing customer acquisition cost at the event level. However, it does not evaluate revenue quality, customer lifetime value, or long-term Customer Retention.
A low CPR may look efficient, yet if those customers do not repurchase or generate meaningful gross margin, the overall impact on sales revenue may be weak.
Marketing Efficiency Ratio: Business-Level Efficiency
As mentioned earlier, the Marketing Efficiency Ratio measures total revenue against total marketing spend across all channels and costs.
Unlike ROAS or CPR, MER captures the combined impact of paid media, ad creation, agency fees, marketing automation tools, influencer partnerships, and other investments that influence customer engagement and brand equity.
In our experience, this is where the shift happens from campaign optimization to business alignment. MER connects marketing decisions to financial outcomes and contribution margin. It evaluates how your entire marketing ecosystem performs, rather than isolating a single ad campaign or channel.
Remember that each metric has a role. ROAS helps you optimize ad channels. CPR helps you manage acquisition events. And MER tells you whether your total marketing investment supports sustainable growth.
MER vs ROAS vs CPR: A Quick Comparison
When to Use Blended ROAS and When to Rely on MER
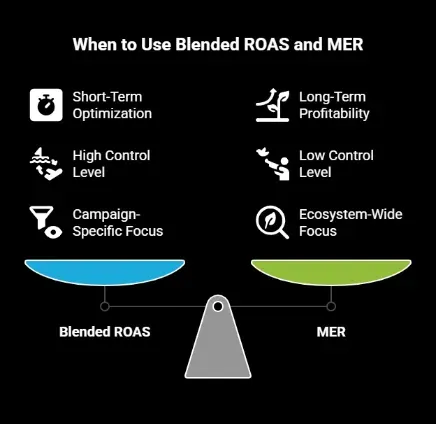
Blended ROAS and Marketing Efficiency Ratio are calculated similarly, yet they serve different decision layers. The real distinction lies in time horizon and control level.
Blended ROAS is best used for short-term optimization. It helps you monitor media spend efficiency across paid media channels on a daily or weekly basis.
Use blended ROAS when you need to:
- Adjust bids or budgets quickly
- Evaluate Ad Creative performance
- Monitor conversion rate shifts
- Fine-tune audience targeting within social media or other digital advertising platforms
From what we have seen across different teams, blended ROAS works well as an operational guardrail. It keeps campaign performance aligned while you test new creative angles or scale conversion campaigns.
MER operates at a different altitude. It is not designed for day-to-day adjustments. Instead, it evaluates whether your total marketing efforts support contribution margin and long-term profitability.
Use the Marketing Efficiency Ratio when you need to:
- Plan quarterly media spend
- Evaluate omnichannel campaigns
- Assess the impact of awareness campaigns and branded search
- Align marketing investment with gross margin and ROI analysis
We have noticed that teams mostly confuse tactical efficiency with business performance. A channel can show strong return on ad spend while total revenue growth remains flat. MER exposes that gap.
Because MER absorbs halo effects across paid media, influencer partnerships, organic traffic, and customer retention initiatives, it reflects how your full marketing ecosystem responds to investment over time.
A simple way to frame it:
- Blended ROAS manages daily execution
- MER governs strategic direction
When you use both together, you control campaign-level performance while protecting sustainable growth.
How to Use MER for Budget Allocation and Forecasting
Marketing Efficiency Ratio becomes most powerful when you use it to define allowable marketing spend in advance.
Start with your revenue target. Then divide it by your target MER to determine how much you can invest in marketing without eroding contribution margin.
For example, if your company plans to generate $5,000,000 in total revenue and your financial model supports a target MER of 5, your allowable marketing spend would be:
This means you can allocate $1,000,000 in total marketing investment to reach your revenue goal.
This approach shifts budgeting from reactive decisions to structured efficiency calculations. Instead of asking how much you can afford to spend, you determine how much you are allowed to spend based on margin realities.
In our experience, teams that pair MER with media mix modeling and incrementality testing make stronger forecasting decisions. These tools help you identify where incremental contribution is strongest and where marginal ROI begins to decline.
MER also changes how you allocate spend across the funnel. Return on ad spend favors bottom-of-funnel conversion campaigns. As a result, awareness campaigns and retention initiatives often appear inefficient in isolation.
MER corrects that imbalance by measuring the combined impact of acquisition, retention, and brand-building efforts. It accounts for cross-channel influence that platform-level metrics often overlook.
A healthy MER reflects disciplined growth rather than isolated performance spikes.
Advanced Strategies to Improve Your Marketing Efficiency Ratio
Marketing Efficiency Ratio improves when every marketing dollar produces stronger revenue and contribution margin.
As per our experience, most teams try to fix MER by reducing media spend. This rarely solves the real issue. Remember thats ustainable improvement comes from strengthening revenue quality and margin structure.
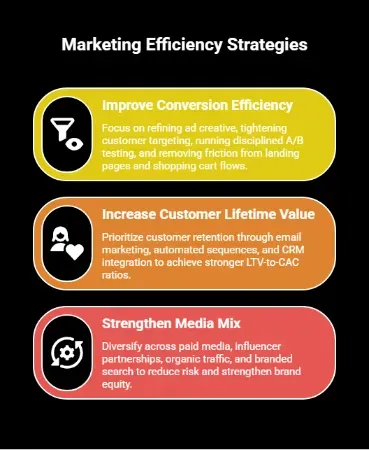
1. Improve Conversion Efficiency Before Increasing Media Spend
Before you increase ad spend, evaluate how efficiently your current traffic converts.
Small shifts in conversion rate usually produce larger improvements in MER than scaling paid media. For example, increasing a conversion rate from 2% to 3% raises revenue by 50% without adding more traffic or media spend.
Focus on:
- Refining ad creative
- Tightening customer targeting
- Running disciplined A/B testing
- Removing friction from landing pages and shopping cart flows
We have noticed that teams frequently overlook funnel friction. They focus on acquisition while ignoring checkout abandonment, unclear product offerings, or weak calls to action. Fixing these issues improves revenue without increasing media spend.
Conversion efficiency also protects gross margin. When more visitors convert, customer acquisition cost stabilizes, and incremental contribution strengthens.
2. Increase Customer Lifetime Value to Stabilize MER
Marketing Efficiency Ratio strengthens when Customer Lifetime Value expands.
When customers repurchase, engage with loyalty programs, or respond to retargeting campaigns, total revenue grows without a corresponding increase in media spend.
Research shows that improving customer retention by just 5% can increase profits by 25% to 95%. This illustrates how powerful long-term engagement can be for overall financial performance.
From what we have seen, brands that prioritize Customer Retention through email marketing, automated sequences, and CRM integration achieve stronger LTV-to-CAC ratios. This shift stabilizes MER, even during volatile market conditions.
Many teams focus heavily on acquisition spikes because they temporarily inflate return on ad spend. Over time, sustainable MER growth depends on repeat purchasing behavior and durable customer engagement.
3. Strengthen your Media Mix and Incremental Contribution
Marketing Efficiency Ratio improves when your marketing campaigns operate as a coordinated system rather than competing for attribution credit.
Remember that heavy reliance on a single ad channel increases volatility and exposes your revenue to platform-level shifts. In contrast, diversifying across acquisition, retention, and demand-generation channels reduces volatility and protects long-term revenue stability.
To understand which channels truly drive incremental contribution, we recommend pairing MER tracking with media mix modeling and incrementality testing. These frameworks reveal where additional ad spend generates real revenue lift and where marginal ROI begins to decline.
In our experience, this is where many teams miscalculate. They scale what performs well inside a dashboard instead of what expands total revenue. Over time, that disconnect compresses contribution margin and distorts efficiency calculations.
When you optimize for business-level impact rather than isolated channel metrics, your Marketing Strategies become more disciplined, resilient, and predictable.
Why Your Marketing Efficiency Ratio Might Be Misleading You
Marketing Efficiency Ratio is powerful, but it is not immune to distortion. If your inputs are flawed, MER will reflect that flaw with false confidence.
Across the teams we work with, we frequently see MER treated as a final answer. But, it is not. It is a diagnostic framework that depends entirely on clean revenue data and disciplined cost accounting.
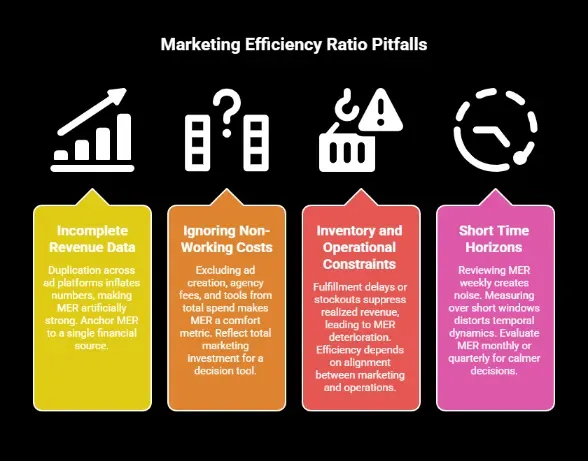
1. Incomplete or Inflated Revenue Data
MER assumes revenue reporting is accurate. In reality, duplication across ad platforms quietly inflates numbers.
When Meta and Google both claim the same sale, marketing dashboards look healthy. If those figures flow directly into your efficiency calculations, your MER becomes artificially strong.
This is where most growth teams slip.
Anchor MER to a single financial source of truth, such as your e-commerce store or ERP system. Platform-reported revenue should guide optimization, not financial modeling.
2. Ignoring Non-Working Costs
Another common oversight is excluding ad creation, agency fees, analytics tools, or marketing automation infrastructure from total marketing spend.
We have audited accounts where media-only MER looked impressive, yet contribution margin told a different story.
If total marketing investment is not reflected in your calculation, your ratio becomes a comfort metric rather than a decision tool.
3. Inventory and Operational Constraints
MER can also deteriorate for reasons unrelated to campaign performance.
We have seen situations where campaign exposure increased demand, but fulfillment delays or stockouts suppressed realized revenue. The ratio dropped, and marketing was blamed, even though operations created the bottleneck.
Efficiency depends on alignment between marketing, inventory, and the sales pipeline. Without that coordination, MER can mislead strategic decisions.
4. Short Time Horizons
MER is a strategic metric. Reviewing it weekly often creates noise rather than clarity.
In B2B SaaS or high-ticket ecommerce environments, sales cycles stretch across months. Measuring efficiency over short windows distorts temporal dynamics and hides Customer Lifetime Value impact.
Teams that evaluate MER monthly or quarterly typically make calmer and more disciplined allocation decisions.
How to Choose the Right North Star Metric for Your Business
Your North Star metric should reflect how your business actually generates profit. The wrong metric creates short-term wins and long-term instability. In contrast, the right one aligns marketing efforts with financial reality.
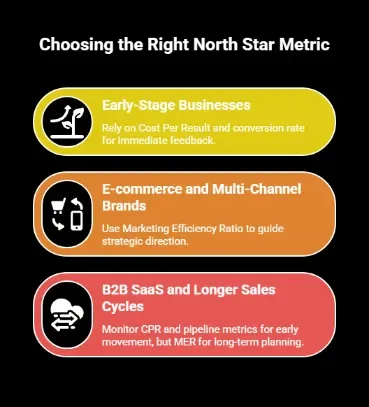
Early-Stage Businesses
Early-stage brands usually rely on Cost Per Result and conversion rate because immediate feedback is critical. At this stage, testing ad creative, customer targeting, and product-market fit matter more than efficiency calculations.
However, once revenue stabilizes and repeat purchases begin contributing to Customer Lifetime Value, relying solely on CPR becomes risky. This is usually the turning point where MER should enter the conversation.
Watch for these signals:
- Customer acquisition cost rising faster than revenue
- Repeat purchases starting to influence total sales
- Contribution margin becoming a strategic priority
We have seen high-growth startups delay this shift and scale acquisition aggressively. Campaign performance looked strong inside dashboards, yet contribution margin quietly deteriorated.
E-commerce and Multi-Channel Brands
For e-commerce stores, the Marketing Efficiency Ratio should guide strategic direction.
These businesses operate inside complex marketing ecosystems. Customer acquisition cost fluctuates, media spend shifts across channels, and awareness campaigns influence future demand. Channel-level metrics cannot capture that interaction.
MER becomes critical when:
- You operate across multiple ad channels
- Attribution is fragmented
- Retention meaningfully impacts profitability
- Gross margin must be actively protected
MER provides the business-level clarity needed to balance acquisition with Customer Retention while protecting gross margin.
B2B SaaS and Longer Sales Cycles
In B2B SaaS environments, temporal dynamics complicate measurement. Sales cycles stretch across months, and revenue recognition often lags campaign exposure.
Here, CPR and pipeline metrics help monitor early-stage movement inside the sales pipeline. However, long-term planning still benefits from MER because it aligns total marketing investment with Customer Lifetime Value and sustainable growth.
MER becomes more relevant when:
- Sales cycles exceed 30–60 days
- Revenue is realized months after campaign exposure
- Customer Lifetime Value significantly exceeds acquisition cost
- Awareness campaigns drive future pipeline growth
From what we have seen, teams that rely only on short-term efficiency signals often underinvest in long-term demand generation.
Make Your Marketing Efficiency Ratio Your Strategic Advantage With 9AM
Marketing and finance teams often define performance differently. Marketing Efficiency Ratio creates shared accountability by connecting campaign performance directly to contribution margin and financial outcomes.
For high-growth brands, this alignment is essential. As budgets scale and market conditions shift, decisions must move beyond platform-level metrics toward business-level sustainability.
At 9AM, we structure media investment around financial clarity. We align paid media, customer retention, and revenue forecasting with your Profit and Loss framework so growth remains disciplined and profitable.
If you want a clearer view of how your marketing investment supports real profitability, book a strategy call with our team. We will review your current framework and identify where stronger alignment can improve long-term performance.
Frequently Asked Questions
How do you measure marketing efficiency?
Marketing efficiency is measured by comparing total marketing spend to the revenue and profit it generates. At a strategic level, the Marketing Efficiency Ratio evaluates total revenue against total marketing investment across all channels.
What is the efficiency ratio of advertising?
The efficiency ratio of advertising typically refers to Return on Ad Spend or Marketing Efficiency Ratio. It measures how much revenue is generated for every dollar invested in advertising.
What is the 70/20/10 rule in marketing?
The 70/20/10 rule suggests allocating 70% of the marketing budget to proven campaigns, 20% to growth opportunities, and 10% to experimentation. It balances stability with innovation while protecting overall marketing efficiency.
What is the 60/40 rule in marketing?
The 60/40 rule recommends spending 60% of the budget on brand-building and 40% on short-term performance campaigns. This balance supports long-term brand equity while still driving immediate sales revenue.
How does 9AM approach media buying and efficiency?
9AM structures media buying around financial sustainability, not just platform performance. We align paid media decisions with contribution margin and long-term profitability for DTC and B2B SaaS brands.
Can 9AM help us better understand our marketing data?
Yes. 9AM translates marketing data into financial insight. Our team connects campaign performance to lifetime value, payback periods, and profit forecasting beyond surface-level dashboards.
Appendix
- https://www.adjust.com/blog/att-opt-in-rates-2025/
- https://keends.com/resources/marketing-insights-report/
- https://www.emarketer.com/content/just-1-5-marketers-confident-last-click-attribution
- https://www.redtrack.io/blog/ecommerce-conversion-rate-optimization-guide/
- https://www.sprinklr.com/blog/customer-retention-statistics/